Surgery, Gastroenterology and Oncology
|
Abstract
Background: The parameters used for predicting choledocholithiasis include clinical presentations, liver function tests, and imaging. Moreover, prediction is essential so as to select suitable therapeutic modalities, which are typically not available in primary hospitals. Thus, a time gap commonly occurs. In this study, we aimed to assess the incremental yield of choledocholithiasis prediction if liver function tests or ultrasonography were repeatedly performed.
Methods: This was a retrospective cohort study of choledocholithiasis reference tests conducted from January 2019 to June 2021. Repeated examinations were frequently available in the department protocol. Eligible patients who underwent repeated liver function tests or ultrasonography were included. The main outcome was analyzed using logistic regression and receiver operating characteristic analyses, which compared the first investigation and the repeated investigation.
Results: Among all the patients, 424 and 146 underwent repeated liver function tests and ultrasonography, respectively. All repeated liver function tests predicted choledocholithiasis; however, only alkaline phosphatase test in the first investigation predicted choledocholithiasis. All imaging parameters in both first and repeated examinations were associated with the presence of stones. However, repeated ultrasonography showed lower false-positive but higher false-negative for choledocholithiasis detection. With regard to the comparison of predictive abilities, the area under the receiver operating characteristic curve for repeated liver function tests and repeated ultrasonography increased from 0.77 to 0.82 (p value of <0.01) and from 0.79 to 0.85 (p value = 0.03), respectively.
Conclusion: Repeated liver function tests or ultrasonography increased the predictive ability to diagnose choledocholithiasis.
INTRODUCTION
Choledocholithiasis or common bile duct [CBD] stone is the presence of stones in the CBD. Various clinical complications can follow, which may sometimes be lethal (1,2). CBD stones are suspected if relevant clinical presentations (jaundice, pancreatitis, or cholangitis), abnormal liver function tests [LFTs], or primary imaging-detected dilated CBD or CBD stones are noted (2,3).
CBD stones have various investigation techniques and therapeutic modalities. The least invasive (e.g., magnetic resonance cholangiopancreatography [MRCP]) is safe but has no therapeutic potential (4). However, endoscopic retrograde cholangiography [ERC] or surgical bile duct exploration can treat the stones but occasionally cause complications (5,6). The choice of modality is usually based on the individual patient’s risk factors (7), and it is generally selected during the clinical occurrence period.
However, most therapeutic modalities for CBD stones are generally available in more advanced hospitals (8); patients with CBD stones are also commonly referred cases. There is usually a time gap between clinical and definitive diagnostic tests. Moreover, CBD stones are known to spontaneously pass into the gastrointestinal tract (9). Although reports exist on changing clinical predictor values in this scenario (10-12), to our knowledge, no literature showed improvement in the prediction performance when the clinical parameters were repeatedly measured. In clinical practice, clinical diagnosis includes all clinical predictors similar to multivariate analysis (13). Thus, the added predictive value of all related clinical parameters may be associated more with clinical applications (14). This study aimed to investigate whether LFTs or primary imaging is repeated in clinical practice and determine the predictive value that repeated measurement adds in the prediction of CBD stone.
MATERIALS AND METHODS
This was a retrospective cohort study of patients suspected of CBD stone from January 2019 to June 2021. The three main reference tests for CBD stones, namely ERC, intraoperative cholangiography or operative bile duct exploration, and MRCP, were reviewed using the eligibility criteria.
This study was conducted at Sawanpracharak Hospital (Nakhon Sawan, Thailand), which is a regional 700-bed tertiary public hospital. The patients in this study comprised both local and referred cases. All data were acquired from the hospital information system.
Inclusion criteria were patients with symptomatic gallstone, cholecystitis, jaundice, gallstone pancreatitis, and cholangitis. Patients with symptomatic gallstone and cholecystitis were included if abnormal LFTs or relevant imaging results (dilated bile duct or imaging-detected CBD stones) were observed. Patients with jaundice were included if gallstone was detected and did not meet the exclusion criteria. The diagnosis of cholecystitis, pancreatitis, and cholangitis was reexamined using standard guidelines (15-17).
Exclusion criteria were patients with previous biliary tract intervention or clinically suspected cancers (painless obstructive jaundice; bilirubin > 100 µmol/L) with anorexia and weight loss as well as imaging-confirmed bile duct dilatation without stones (18,19). Patients in whom malignancy was initially suspected but only CBD stones were eventually confirmed were also excluded.
Potential CBD stone predictors and interacting variables were reviewed (i.e., patient’s age, sex, jaundice, gallstone pancreatitis, cholangitis, status post cholecystectomy, cirrhosis, LFTs, and relevant imaging results). LFTs included serum glutamic oxaloacetic transaminase, serum glutamic pyruvic transaminase, alkaline phosphatase, and total bilirubin. Screening imaging methods included transabdominal ultrasono-graphy [US] or computed tomography [CT]. CBD stone detection and CBD size in millimeters were considered recorded imaging parameters. CBD size was acquired from the initial reports (if available) or measured from the hospital picture archiving and communication system by the participating radiologist. Cirrhosis was identified using known diagnosis or morphological change from imaging studies.
The study hospital follows a protocol for repeating LFTs before reference tests. However, some physicians chose not to repeat the LFTs. Data were excluded if LFTs were performed more than 7 days prior to the reference tests. The study hospital does not have any protocols for repeat imaging before reference tests. Nevertheless, some doctors decided to repeat the imaging using US. Eligible patients were later checked for repeated LFTs or US investigation. Only patients with more than one LFT or more than one imaging investigation were included, and patients with a single LFT or imaging examination were excluded.
The status of CBD stones was evaluated using the reference tests. The tests chosen were decided upon by the attending physicians. CBD stone was present (detected) if visualized in the endoscopic or operative field during any therapy session. Images were reviewed by either two endoscopists or one of the endoscopists and a radiologist if CBD stones were not visible (e.g., because of fluoroscopic or radiologic filling defects and patients lost to follow-up). CBD stone was absent (not detected) if the reference rests did not detect the stone in at least 5–6 months of follow-up [FU] without related symptoms and normal LFTs, with or without imaging FU. Patients with <5 months of FU were contacted by phone to check for symptom persistence or therapy in other hospitals. A negative response for both questions resulted in classifying the result of CBD stones as absent. However, CBD stones were still recorded as absent if the reference rests did not detect the stone and patients were found to have passed away or lost contact. However, the 5- to 6-month FU was not required if patients underwent a repeat examination with any of the reference tests. Inconclusive outcomes were excluded. All FU data were retrospectively reviewed from the hospital records data, while phone contacts were organized during the data collection process.
For univariate comparison, the t-test or Mann-Whitney U test was used for continuous data, and Fisher’s exact test was used for categorical data. Receiver operating characteristic [ROC] analyses were conducted to measure the discriminative ability of each variable and compare the discriminatory power of similar variables during the first and repeated examinations.
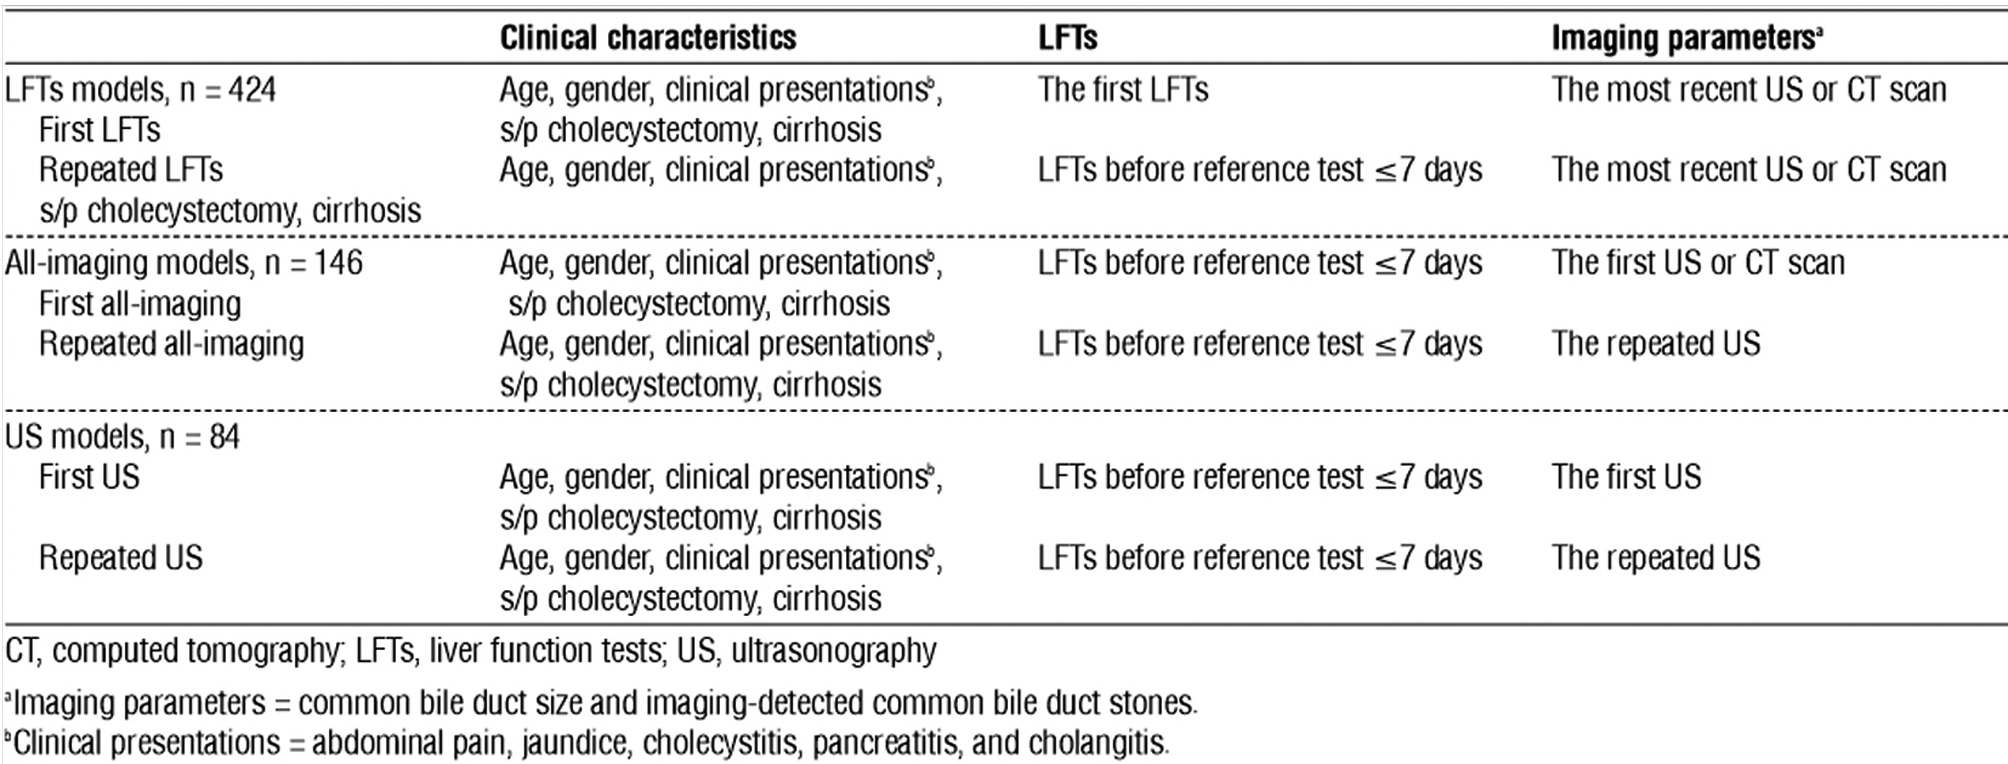
The main objective of this study was analyzed through multivariate logistic regression and ROC analyses. Predictors in the multivariate model were age, sex, status post cholecystectomy, cirrhosis, clinical presentations (abdominal pain, jaundice, cholecystitis, pancreatitis, and cholangitis), LFTs, and imaging parameters. The additive predictive ability of the repeated examination was analyzed by changing the examined value. Two analytic models (i.e., first and repeated examinations) for LFTs were employed. All predictors included in logistic regression were similar, with a change observed between the first and the repeated values of the LFTs. The most recent imaging results were used for both models. Two LFT models of the CBD stone predictive value were calculated and compared using ROC analyses.
Primary imaging investigations for CBD stones were US or CT scans. However, repeated imaging investigations were only performed using US. The comparisons were then divided into the all-imaging model (first imaging modality was US or CT, and repeat imaging was conducted using US) and the US model (first and repeated imaging modalities were US). The analytic models for imaging examination were thereby composed of first all-imaging vs. repeated all-imaging and first US vs. repeated US. All variables in the logistic regression analysis were similar, with the exception of different imaging parameters (CBD size and CBD stone detection) as per the examined models. The most recent LFT results were used for entire imaging models. The predicted ability for two all-imaging models was calculated and compared. The CT scan data were sub-sequently removed, and the data from the two US models were then analyzed using the same process. Table 1 summarizes the details of the multivariate analytic models.
Table 1 - Summary of the multivariate logistic regression analytic models in the study
Statistical significance was set at p <0.05. All statistical analyses were conducted using statistical software (STATA 17; StataCorp, College Station, TX, USA).
RESULTS
This study identified 1,185 patients during the data collection period. However, 585 patients were excluded because of the following: meeting the exclusion criteria, having missing or duplicate data, showing inconclusive outcomes, and showing the absence of pretest LFTs. Ten patients, who were clinically suspected with CBD stones but later detected with benign bile duct strictures and malignancies, were also excluded. Five hundred ninety patients remained. The availability of repeated examination was then inspected. Of the remaining patients, 424 had repeating LFT examination; among these, 146 and 84 patients had repeating US examination and US as their first imaging, respectively. Fig. 1 illustrates the summary of participant flow.
|
Figure 1 - Study participants' flow diagram CT, computed tomography; CBD, common bile duct; ERC, endoscopic retrograde cholangiography; cholangiopancreatography; s/p, status-post; US, ultrasonography aPrereference LFTs = LFTs within 7 days before reference tests. bParticipant numbers regarding CBD stone status of the first imaging with CT or US and repeated with US, and the first and repeated imaging with US, respectively
|
 |
Table 2 presents the patients’ characteristics of repeated LFTs and repeated all-imaging data. Both of the abovementioned groups had a high CBD stone prevalence at 59.0% and 55.5%. Most patients were elderly women and presented with cholangitis, with data in similar proportions. The interval from clinical presentation to the reference tests was approximately 1 month. ERC accounted for over 80% of the reference tests.
Table 2 - Patients' characteristics
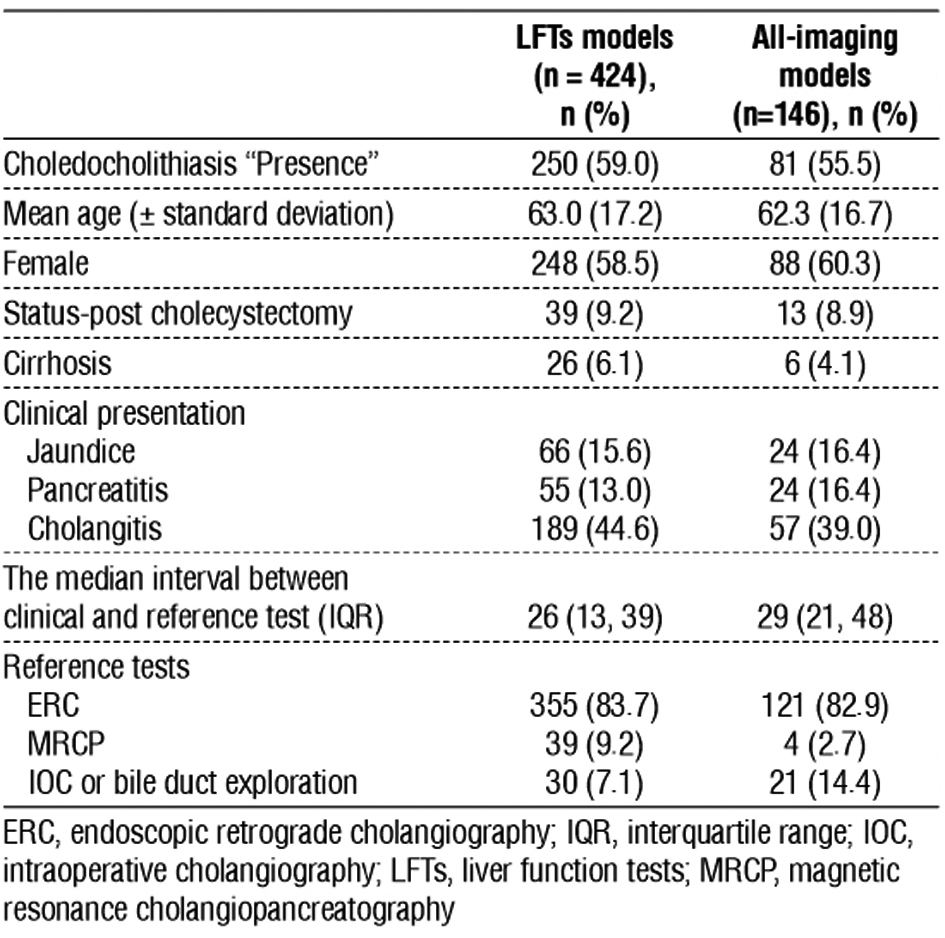
The median time intervals from the examination to the reference tests of the first and repeated LFTs were 24.5 days (interquartile range [IQR] = 12.5, 37) and 1 day (IQR = 1, 1), respectively. The median intervals for imaging were 28 days (IQR = 17, 42) for the first imaging and 1 day (IQR = 1, 3) for repeated US in the all-imaging data. CT scan accounted for 42.5% (62 patients) of the first imaging in the all-imaging models.
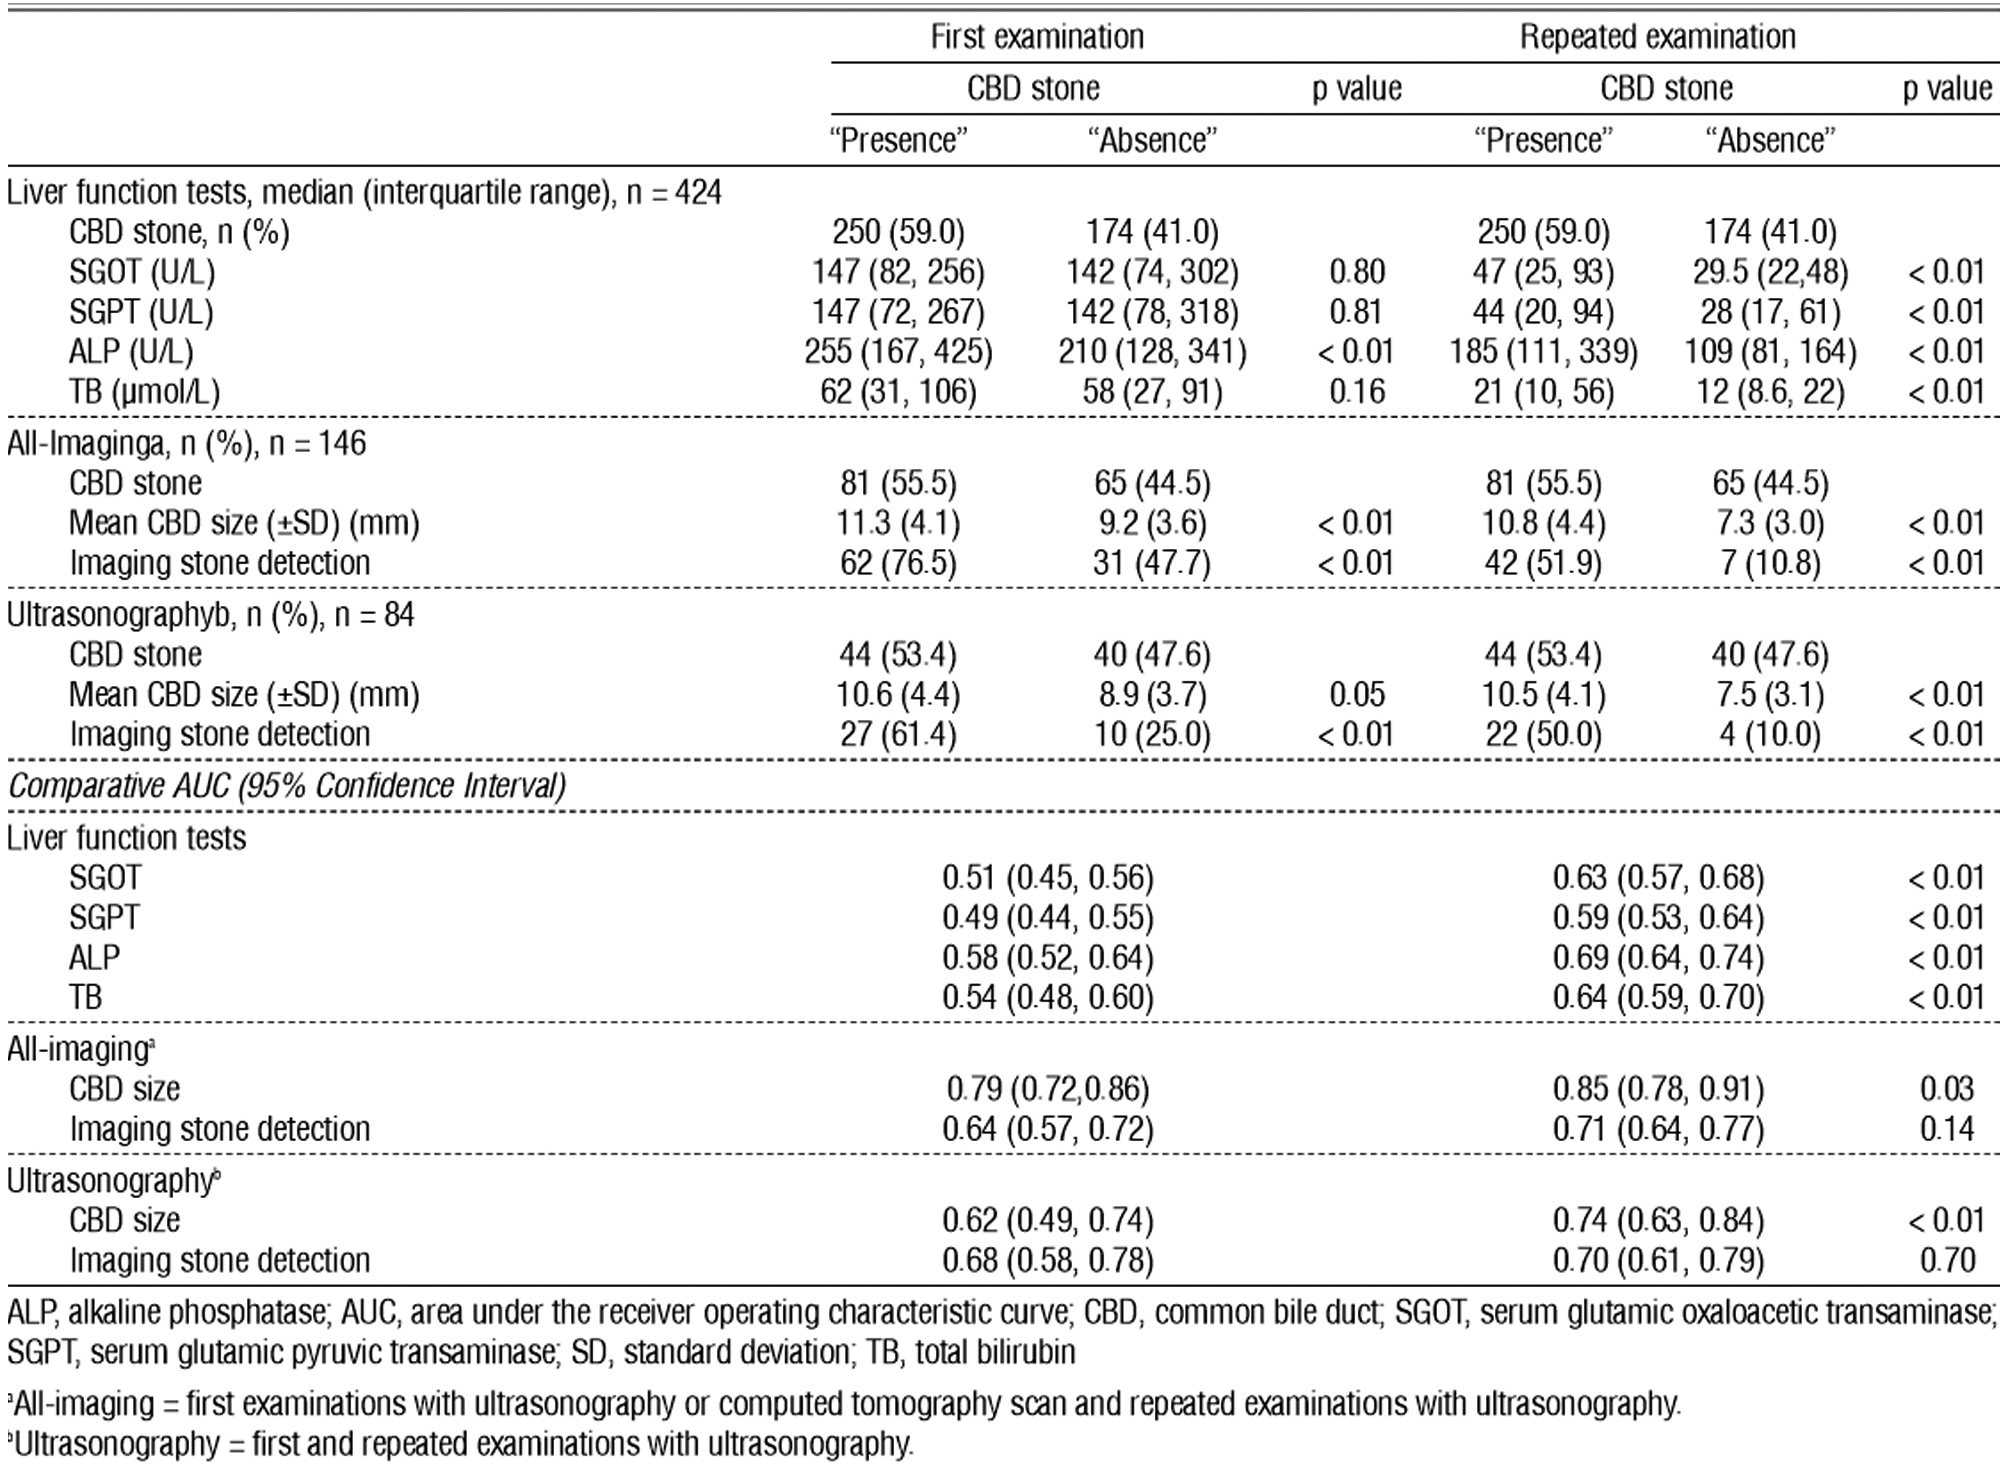
Table 3 shows the distribution of LFTs and imaging parameters among the CBD stone presence and absence groups. It also displays the predictive ability of the parameters in terms of the first and repeated examination. Moreover, only the alkaline phosphatase value of the first examination was significantly higher in patients with CBD stone presence, or only alkaline phosphatase could predict the presence of CBD stones. In contrast with repeated LFTs examination, the value of all LFTs was significantly higher in patients with CBD stone presence. All imaging parameters (CBD size and CBD stone detection) were significantly different among the CBD stone detection groups in both first and repeated examination. The patients with CBD stones had larger CBD sizes and a higher proportion of imaging-detected CBD stones. Notably, the percentage of CBD stone detection decreased in repeated imaging. In patients with CBD stone presence, the ratio declined from 76.5% during the first examination to 51.9% during the repeated examination or higher false-negative proportion. In patients with CBD stone absence, the proportion of CBD stone detection decreased from 47.7% during the first examination to only 10.8% during the repeated examination or lower false-positive proportion. Areas under the ROC curve [AUC] reflect discriminative or predictive ability. AUC at 0.7 and 0.8 was an acceptable and excellent ability, respectively (20). The AUC for all predictors of the repeated examination was significantly superior to that of the first examination, with the exception of AUC for imaging-detected CBD stone. Nevertheless, its p value was close to 0.05 at 0.14. Only the CBD size of the all-imaging model had AUC with a 95% confidence interval [CI] >0.7. The AUC was above this level in both the first and the repeated imaging investigations, although the repeated examination showed a higher AUC value.
Table 3 - Distribution of liver function tests and imaging parameters between CBD stone presence and absence groups with the predictors' AUC
The added predictive ability of the repeated LFTs and repeated imaging investigations can be interpreted by comparing the ROCs in figs. 2 and 3. Repeated LFTs had a significantly better AUC (AUC for repeated LFTs vs. AUC for the first LFT; 0.82 (95% CI = 0.77, 0.86) vs. 0.77 (95% CI = 0.73, 0.82); p value < 0.01). The outcome was similar for the all-imaging models. Repeated imaging had a significantly better AUC (AUC for repeated all-imaging vs. AUC for first all-imaging; 0.85 (95% CI = 0.78, 0.91) vs. 0.79 (95% CI = 0.72, 0.86); p value = 0.03). However, although repeated US AUC was better, it was not statistically significant (AUC for repeated US vs. AUC for the first US: 0.83 (95% CI = 0.74, 0.92) vs. 0.80 (95% CI = 0.71, 0.90); p value = 0.25). The nonsignificant result might be because of the use of data obtained from limited number of participants (n = 84) with large 95% CI (21).
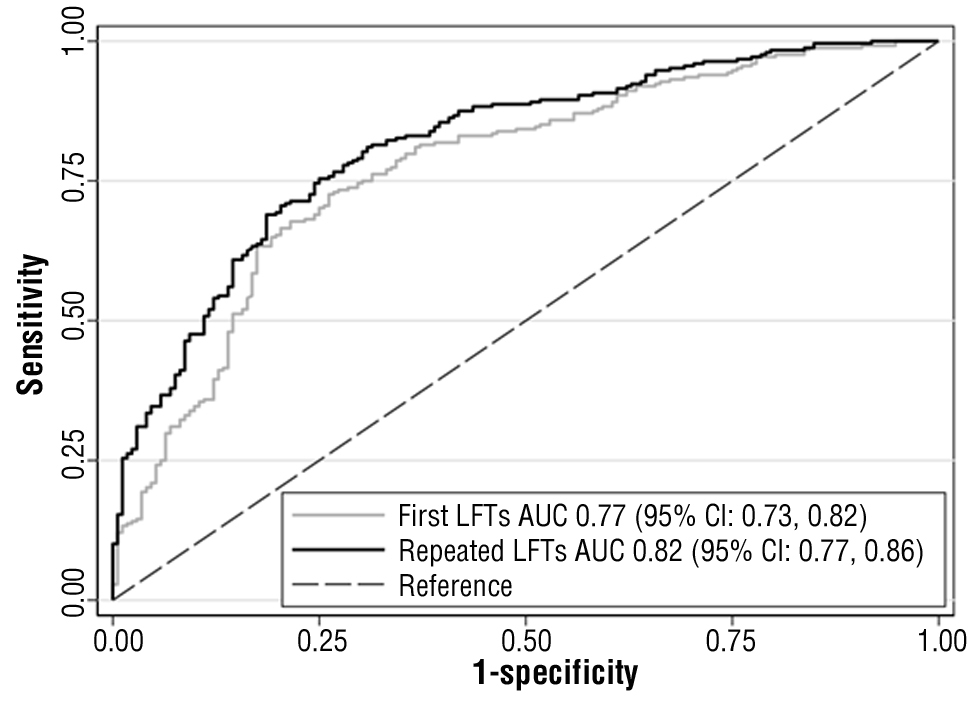
Figure 2 - The ROC of the first and repeated LFTs model
(Comparing AUC’s p value <0.01).
AUC, area under the receiver operating characteristic curve; CI, confidence interval; LFTs, liver function tests; ROC, receiver operating characteristic curves
Figure 3 - The ROC of first and repeated regarding the all-imaging modelsa (a) and the ultrasonography modelsb (b) (Comparing AUC’s p value were 0.03 and 0.25, respectively).
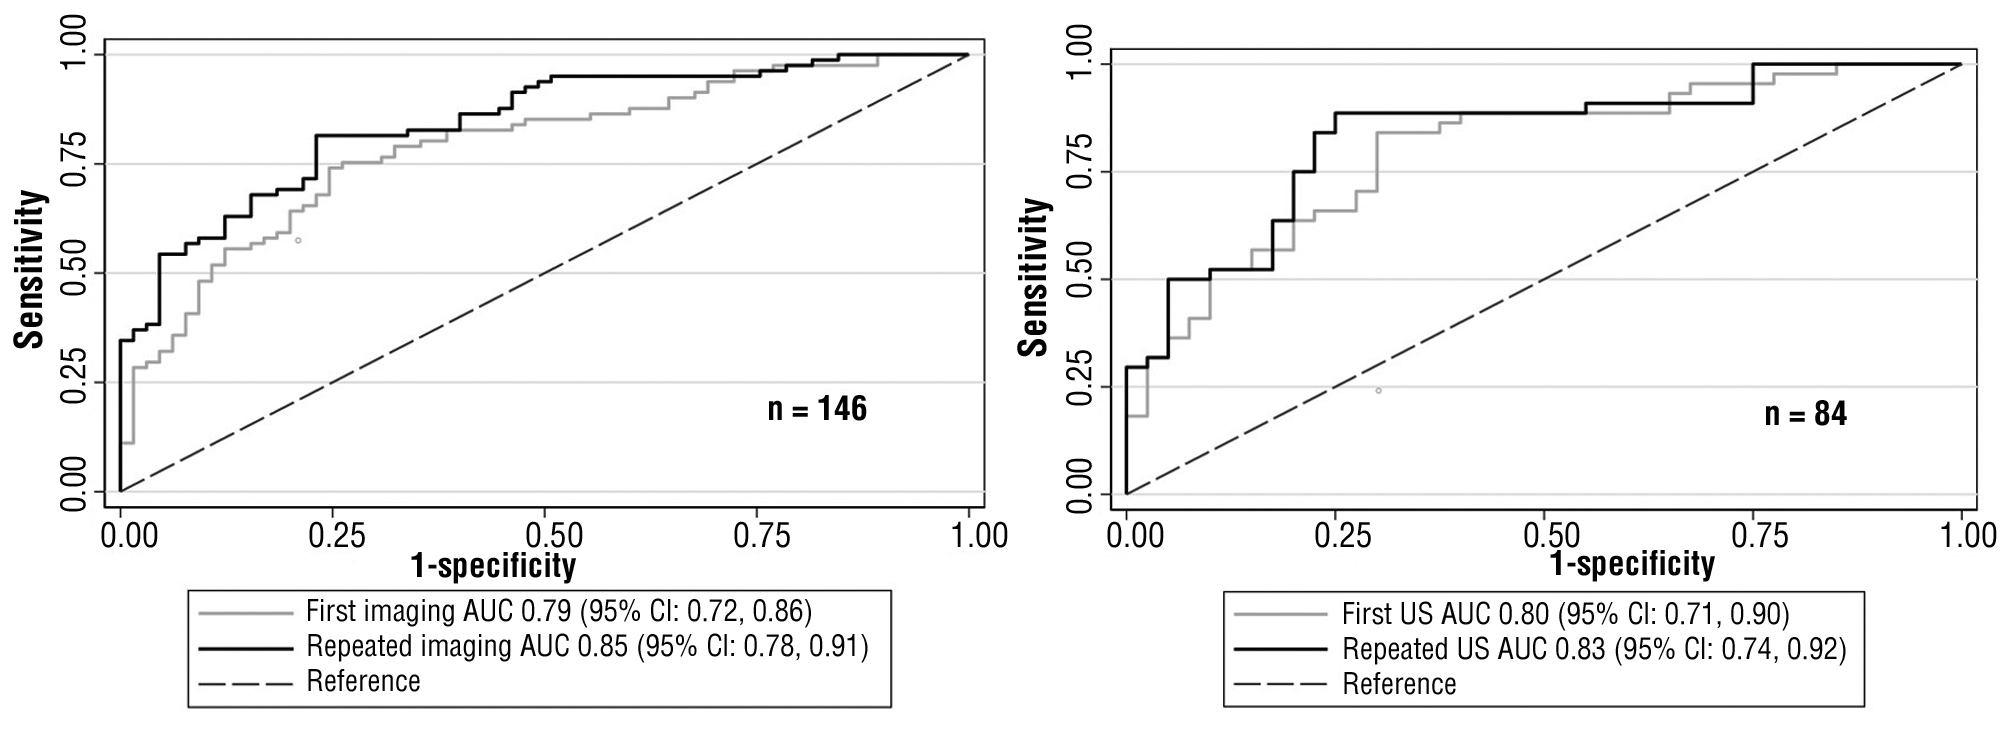
AUC, area under the receiver operating characteristic curve; CI, confidence interval; ROC, receiver operating characteristic curves; US, ultrasonography
aAll-imaging models = first examinations with ultrasonography or computed tomography scan and repeated examinations with ultrasonography.
bUltrasonography models = first and repeated examinations with ultrasonography.
DISCUSSION
The results of this study show that repeated LFTs or imaging (with US in the present cohort) showed a better correlation with CBD stone and significantly increased CBD stone predictive value. Only the alkaline phosphatase of the first LFTs was associated with the CBD stone presence group, which is in contrast with all LFT parameters of repeated examination. Thus, LFTs performed before reference tests should be used as a predictor of CBD stone. However, although repeated LFTs examination increased the predictive ability, each parameter of the LFTs showed a relatively low discriminative ability even in the repeated test. The AUC of these variables marginally reached 0.7. Some studies suggested interpreting LFTs by comparing the first and repeated values. If the values for the LFTs remained elevated, CBD stones were likely retained rather than spontaneously passing into the gastrointestinal tract (10,12).
Differences in CBD size among CBD stone presence and absence groups were larger in the repeated imaging examination (11.3 vs. 9.2 mm for first imaging and 10.8 vs. 7.3 mm for repeated imaging), affirming the increased predictive ability of the repeated imaging investigation. However, a notable aspect of imaging-detected CBD stone was observed. The repeated imaging had lower false-positive results for CBD stone detection (the proportion of false-positive cases in the first imaging vs. that in the repeated imaging: 47.7% vs. 10.8%). However, the repeated imaging had higher false-negative results or was able to detect CBD stones to a lesser extent (the proportion of false-negative cases in the first imaging vs. that in the repeated imaging: 23.5% vs. 48.1%). The lower chance of CBD stone detection may be secondary to the higher diagnostic efficacy of a CT scan than US (22), accounting for 42.5% (62 patients) of the first imaging in the all-imaging models. However, when CT scan data were excluded, the proportion was still relatively similar (the proportion of false-negative cases of the first US vs. the repeated US CBD stone detection: 38.6% vs. 50.0%). The lower false-positive numbers reflected the spontaneous passage of CBD stones. However, the inability to detect CBD stones (higher false-negative) in the repeated imaging can partially be explained by including CT scan data in the first imaging. Other potential reasons are that the stones show a trend of being located in the distal part of the CBD (23), a location that limits the detection of CBD stone via US because of having its surroundings obscured by duodenal gas (24).
The best CBD stone predictive ability was incorporating all clinical parameters with the most recent basic investigations (AUC=0.85; 95% CI=0.78, 0.91). However, repeating all examinations may be difficult in clinical practice, particularly imaging examinations. The predictive ability of the first all-imaging model (with repeated LFTs examination) was also relatively high (AUC=0.79; 95% CI=0.72, 0.86). The benefit of the repeated US in the present cohort was the repeated measured CBD size was more related to presence of the stones (CBD size’s AUC of first vs. repeated imaging: 0.79 (95% CI= 0.72, 0.86) vs. 0.85 (95% CI=0.78, 0.91)) and probably the ability to overcome the spontaneous passage of CBD stone (lower false-positive proportion). However, the chance of CBD stone detection was lower (higher false-negative proportion). Thus, repeated imaging with CT scan may be more appealing, but whether it is beneficial in clinical practice warrants further studies. CT scan also had a more adverse effect on patients, e.g., radiation exposure (25), contrast-induced nephrotoxicity, or allergic reaction (26). Moreover, CT may not be superior to US in terms of CBD stone prediction in real-life practice (27). According to the results of this study, the repeated imaging examination with US also showed the incremental predictive value benefit, as illustrated in fig. 3 (a).
This study had considerable limitations. First, this study was potentially subjected to selection bias in at least two processes. One was the patients’ selection from the outcome (reference tests) rather than clinical presentations. Some patients may have minimal LFT abnormality or minimal imaging changes (e.g., minimal dilated CBD). In this case, physicians may choose to observe without performing reference tests. However, the selection protocol was not changed because of the outcome validity. Another potential selection bias was that a large proportion of patients were excluded owing to the absence of repeated investigation. Moreover, endoscopic ultrasonography, one of the CBD stone reference tests (28), was not included because it was not available during the study period. In this problem associated with selection, changing the protocol to that of a prospective study may be more suitable in future studies. Second, imaging comparison models may not be ideal caused by the difference in diagnostic property between US and CT scans. However, the result of this study revealed the incremental benefit of repeated imaging studies even using US. Although US has lower diagnostic properties, it is safer. With increased CT availability and accessibility, conducting the study using only US may be impractical. Finally, the only US comparison model showed a nonsignificant result and was likely secondary to limited statistical power. The wide 95% CI (approximately 0.70–0.90) of the AUC values indicated an insufficient number of participants (21). Thus, interpretation of the results in this group of patients is limited.
In conclusion, repeated LFTs or imaging examinations with US added the predictive ability to CBD stone diagnosis. When choosing CBD stone reference tests, consideration should be based on the most recent investigations. However, organizing repeated imaging investigations may be complicated in clinical practice. Although repeated imaging examination with US could help in the evaluation of the CBD size and the spontaneous passage of CBD stones more accurately, it could lead to more cases of missed CBD stones. Thus, whether repeated imaging should be conducted using a CT scan requires further research.
Acknowledgments
We thank Edanz (www.edanz.com/ac) for editing a draft of this manuscript.
Conflict of interest
The authors declare that they have no conflicts of interest or financial ties to disclose.
Funding
The authors received financial support from Sawanpracharak Hospital Medical Education center (http://mec.spr.go.th) for the language editing and the publication.
Ethical statement
The study protocol was approved by the Ethics Committee for Research using Human Subjects of our hospital. The requirement for patient consent was waived because of the retrospective study design and use of deidentified data.
References
1.Desai R, Shokouhi BN. Common bile duct stones - their presentation, diagnosis and management. Indian J Surg. 2009;71:229-237.
2.Freitas ML, Bell RL, Duffy AJ. Choledocholithiasis: evolving standards for diagnosis and management. World J Gastroenterol. 2006;12: 3162-3167.
3.Costi R, Gnocchi A, Di Mario F, Sarli L. Diagnosis and management of choledocholithiasis in the golden age of imaging, endoscopy and laparoscopy. World J Gastroenterol. 2014;20:13382-13401.
4.Mercer S, Singh S, Paterson I. Selective MRCP in the management of suspected common bile duct stones. HPB (Oxford). 2007;9:125-130.
5.Masci E, Toti G, Mariani A, Curioni S, Lomazzi A, Dinelli M et al. Complications of diagnostic and therapeutic ERCP: a prospective multicenter study. Am J Gastroenterol. 2001;96:417-423.
6.Gao YC, Chen J, Qin Q, Chen H, Wang W, Zhao J et al. Efficacy and safety of laparoscopic bile duct exploration versus endoscopic sphincterotomy for concomitant gallstones and common bile duct stones: A meta-analysis of randomized controlled trials. Medicine (Baltimore). 2017;96:e7925.
7.Wang L, Mirzaie S, Dunnsiri T, Chen F, Wilhalme H, MacQueen IT. et al. Systematic review and meta-analysis of the 2010 ASGE non-invasive predictors of choledocholithiasis and comparison to the 2019 ASGE predictors. Clin J Gastroenterol. 2022;15:286-300.
8.Ahmed M, Kanotra R, Savani GT, Kotadiya F, Patel N, Tareen S et al. Utilization trends in inpatient endoscopic retrograde cholangio-pancreatography (ERCP): A cross-sectional US experience. Endosc Int Open. 2017;5:E261-E271.
9.Tranter SE, Thompson MH. Spontaneous passage of bile duct stones: frequency of occurrence and relation to clinical presentation. Ann R Coll Surg Engl. 2003;85:174-177.
10.Isherwood J, Garcea G, Williams R, Metcalfe M, Dennison AR. Serology and ultrasound for diagnosis of choledocholithiasis. Ann R Coll Surg Engl. 2014;96:224-228.
11.Khoury T, Adileh M, Imam A, Azraq Y, Bilitzky-Kopit A, Massarwa M et al. Parameters Suggesting Spontaneous Passage of Stones from Common Bile Duct: A Retrospective Study. Can J Gastroenterol Hepatol. 2019;2019:5382708.
12.Ahn KS, Yoon YS, Han HS, Cho JY. Use of liver function tests as first-line diagnostic tools for predicting common bile duct stones in acute cholecystitis patients. World J Surg. 2016;40:1925-1931.
13.Moons KG, Biesheuvel CJ, Grobbee DE. Test research versus diagnostic research. Clin Chem. 2004;50:473-476.
14.Pencina MJ, D'Agostino RB, Sr, D'Agostino RB, Jr, Vasan RS. Evaluating the added predictive ability of a new marker: from area under the ROC curve to reclassification and beyond. Stat Med. 2008; 27:157-172; discussion 207-112.
15.Yokoe M, Hata J, Takada T, Strasberg SM, Asbun HJ, Wakabayashi G et al. Tokyo Guidelines 2018: diagnostic criteria and severity grading of acute cholecystitis (with videos). J Hepatobiliary Pancreat Sci. 2018;25:41-54.
16.Tenner S, Baillie J, DeWitt J, Vege SS, American College of G. American College of Gastroenterology guideline: management of acute pancreatitis. Am J Gastroenterol. 2013;108:1400-1415; 1416.
17.Kiriyama S, Kozaka K, Takada T, Strasberg SM, Pitt HA, Gabata T et al. Tokyo Guidelines 2018: diagnostic criteria and severity grading of acute cholangitis (with videos). J Hepatobiliary Pancreat Sci. 2018; 25:17-30.
18.Garcea G, Ngu W, Neal CP, Dennison AR, Berry DP. Bilirubin levels predict malignancy in patients with obstructive jaundice. HPB (Oxford). 2011;13:426-430.
19.Pu LZ, Singh R, Loong CK, de Moura EG. Malignant Biliary Obstruction: evidence for best practice. Gastroenterol Res Pract. 2016;2016:3296801.
20.Mandrekar JN. Receiver operating characteristic curve in diagnostic test assessment. J Thorac Oncol. 2010;5:1315-1316.
21.Hazra A. Using the confidence interval confidently. J Thorac Dis. 2017;9:4125-4130.
22.Mitchell SE, Clark RA. A comparison of computed tomography and sonography in choledocholithiasis. Am J Roentgenol. 1984;142: 729-733.
23.De Silva WSL, Pathirana AA, Wijerathne TK, Gamage BD, Dassanayake BK, De Silva MM. Epidemiology and disease characteristics of symptomatic choledocholithiasis in Sri Lanka. Ann Hepatobiliary Pancreat Surg. 2019;23:41-45.
24.Einstein DM, Lapin SA, Ralls PW, Halls JM. The insensitivity of sonography in the detection of choledocholithiasis. Am J Roentgenol. 1984;142:725-728.
25.Power SP, Moloney F, Twomey M, James K, O'Connor OJ, Maher MM. Computed tomography and patient risk: Facts, perceptions and uncertainties. World J Radiol. 2016;8:902-915.
26.Kobayashi D, Takahashi O, Ueda T, Deshpande GA, Arioka H, Fukui T. Risk factors for adverse reactions from contrast agents for computed tomography. BMC Med Inform Decis. 2013;13:18.
27.Orman S, Senates E, Ulasoglu C, Tuncer I. Accuracy of Imaging Modalities in Choledocholithiasis: a real-life data. Int Surg. 2018; 103:177-183.
28.Meeralam Y, Al-Shammari K, Yaghoobi M. Diagnostic accuracy of EUS compared with MRCP in detecting choledocholithiasis: a meta-analysis of diagnostic test accuracy in head-to-head studies. Gastrointest Endosc. 2017;86:986-993.
Full Text Sources:
Abstract:
Views: 3758

For Authors
Journal Subscriptions

Mar 2026
Supplements
Instructions for authors
Online submission
Contact
e-ISSN: 2601 - 1700 (online)
ISSN-L: 2559 - 723X
Journal Abbreviation: Surg. Gastroenterol. Oncol.
Surgery, Gastroenterology and Oncology (SGO) is indexed in:
- SCOPUS
- EBSCO
- DOI/Crossref
- Google Scholar
- SCImago
- Harvard Library
- Open Academic Journals Index (OAJI)
Surgery, Gastroenterology and Oncology (SGO) is an open-access, peer-reviewed online journal published by Celsius Publishing House. The journal allows readers to read, download, copy, distribute, print, search, or link to the full text of its articles.
Time to first editorial decision: 25 days
Rejection rate: 61%
CiteScore: 0.2

Meetings and Courses in 2025
Meetings and Courses in 2024
Meetings and Courses in 2023
Meetings and Courses in 2022
Meetings and Courses in 2021
Meetings and Courses in 2020
Meetings and Courses in 2019
Verona expert meeting 2019

Surgery, Gastroenterology and Oncology applies the Creative Commons Attribution Non Commercial (CC BY-NC 4.0) license, which permits readers to copy and redistribute the material in any medium or format, remix, adapt, build upon the published works non-commercially, and license the derivative works on different terms, provided the original material is properly cited and the use is non-commercial. Please see: https://creativecommons.org/licenses/by-nc/4.0/
Publisher’s Note:
The opinions, statements, and data contained in article are solely those of the authors and not of Surgery, Gastroenterology and Oncology journal or the editors. Publisher and the editors disclaim responsibility for any damage resulting from any ideas, instructions, methods, or products referred to in the content.