Surgery, Gastroenterology and Oncology

|
|
Background: Breast cancer is still the most common cancer incident and the leading cause of death in women. Chemotherapy, as the primary therapeutic modality, currently has both short-term and long-term side effects that affect the patient's quality of life. Body Mass Index (BMI), Fat Mass Index (FMI), and Fat-Free Mass Index (FFMI) reflect nutritional status that is thought to be related to quality of life. This study aims to analyze the correlation between BMI, FMI, and FFMI on the quality of life of breast cancer patients undergoing chemotherapy.
Methods: A prospective cohort study was conducted among 37 patients with breast cancer undergoing chemotherapy at Hasanuddin University Hospital and Wahidin Sudirohusodo Hospital in Makassar from September 2024 to March 2025. Body composition was estimated using a Tanita BC-730 bioelectrical impedance device. The quality of life was assessed using the EORTC QLQ-BR45 questionnaire. Bivariate analysis was performed to examine correlations between body composition parameters and the Quality of Life (QoL).
Results: Females had a significantly lower BMI (p=0.002) and lower FMI (p=0.003) after chemotherapy. This study revealed a positive correlation between changes in the Functional scale and changes in BMI (r2=0.054, p=0.169), FMI (r2=0.022, p=0.166), and FFMI (r2=0.072, p=0.107). A positive correlation between the change of Symptom Scale and changes in BMI (r2=0.008, p=0.289). changes FMI (r2=0.005, p=0.238), FFMI (r2=9.4, p=0.607).
Conclusions: BMI, FMI, and FFMI were not significantly correlated with the quality of life of breast cancer patients undergoing chemotherapy.
INTRODUCTION
The Global Cancer Observatory (GCO) 2022 shows that breast cancer is the number one cancer in Indonesia, with a 50% mortality rate of new cases (1). Data from 2002 to 2019 indicated that breast cancer is the most common cancer in Makassar (2). Chemotherapy is widely recognized as a primary treatment modality for breast cancer, particularly in various stages of the disease. It serves multiple purposes, including adjuvant therapy after surgery, neoadjuvant therapy to shrink tumors before surgery, and palliative care for metastatic cases (3). However, it often leads to various physical and emotional challenges that can diminish quality of life (QoL).
Furthermore, these challenges may lead to a poor prognosis, presenting a higher risk of toxicity and breast cancer recurrence (4). Additionally, above-average body composition posttreatment was associated with a better quality of life (5). This study aims to assess the correlation between body composition (BMI, FMI, and FFMI) and quality of life in breast cancer patients undergoing chemotherapy.
MATERIALS AND METHODS
Study Design
This study employed an analytical observational design with a cohort prospective approach. This design involves assessing the same group of participants, specifically outpatients. The repeated measures design enables direct comparisons by measuring the same respondents three times, thereby reducing variability due to individual differences.
Data Collection
Assessments were performed twice: prechemo-therapy, before the first chemotherapy, and post-chemotherapy, after all chemotherapy cycles were completed. We recorded anthropometric and body composition data. Specifically, we measured body weight (to the nearest 0.1 kg) and height (to the nearest 0.5 cm) to calculate body mass index (BMI; weight [kg]/height [m]2). Body composition, namely FM and FFM from resistance using the equation of Sun (6), was evaluated three times using bioelectrical impedance analysers (BC 730 TANITA [Arlington, USA] in English) and cross-validated against one another. Waist circumference (WC) was measured with an inelastic tape at the midpoint between the anterior superior iliac crest and the last rib, while hip circumference (HC) was measured at the largest circumference around the buttocks (7).
Quality of life (QoL) was assessed using the European Organization for the Research and Treatment of Cancer Quality of Life Questionnaire (EORTC QLQ-C45)(8). This questionnaire consists of 45 questions measuring functional and symptom scales before and after the 6th cycle of chemotherapy. All of the scales measure a range in score from 0 to 100. Higher scores on the functional scale indicate good functioning. On the other hand, higher scores on the symptom scale indicate worse symptomatology among patients.
Participants
The participants in this study were outpatients from the oncology polyclinic at Dr. Wahidin Sudirohusodo Hospital and Hasanuddin University Hospital in Makassar, Indonesia. Thirtynine respondents participated in this study using a total sampling method, with specific inclusion and exclusion criteria in place to ensure they met the requirements for participation.
In these studies, standard inclusion criteria were age 18-65 years old, confirmed breast cancer stage I, II, III, who underwent chemotherapy at Dr. Wahidin Sudirohusodo Hospital and Hasanuddin University Hospital in Makassar, Indonesia, from September 2024 to March 2025. Patients with oedema, ascites, and those using implanted pacemakers or defibrillators were excluded to avoid interference with the assessment of body composition. During the study, 2 participants passed away due to their diseases. Data from 37 participants were analyzed for this study.
Statistical Analysis
Data were analyzed using IBM SPSS Statistics for Mac (version 29.0.0.0, IBM Corp, Armonk, NY, USA, 2022). Descriptive statistics are presented as a number, a percentage, and a mean ± standard deviation (SD). Data were presented as means and standard deviations for numerical data, or numbers and percentages for categorical data. Shapiro-Wilk test, to assess data normality. Paired t-test, to compare numerical data before and after treatment, where the data is normally distributed. The Wilcoxon Signed Ranks test is used to compare numerical data before and after treatment when the data are not normally distributed. Pearson's Correlation test assesses the correlation between two numerical data sets, assuming the data is normally distributed. Spearman's Correlation test is used to assess the correlation between two numerical datasets when the data is not normally distributed. Correlation analyses were performed in R at the p < 0.05 significance level.
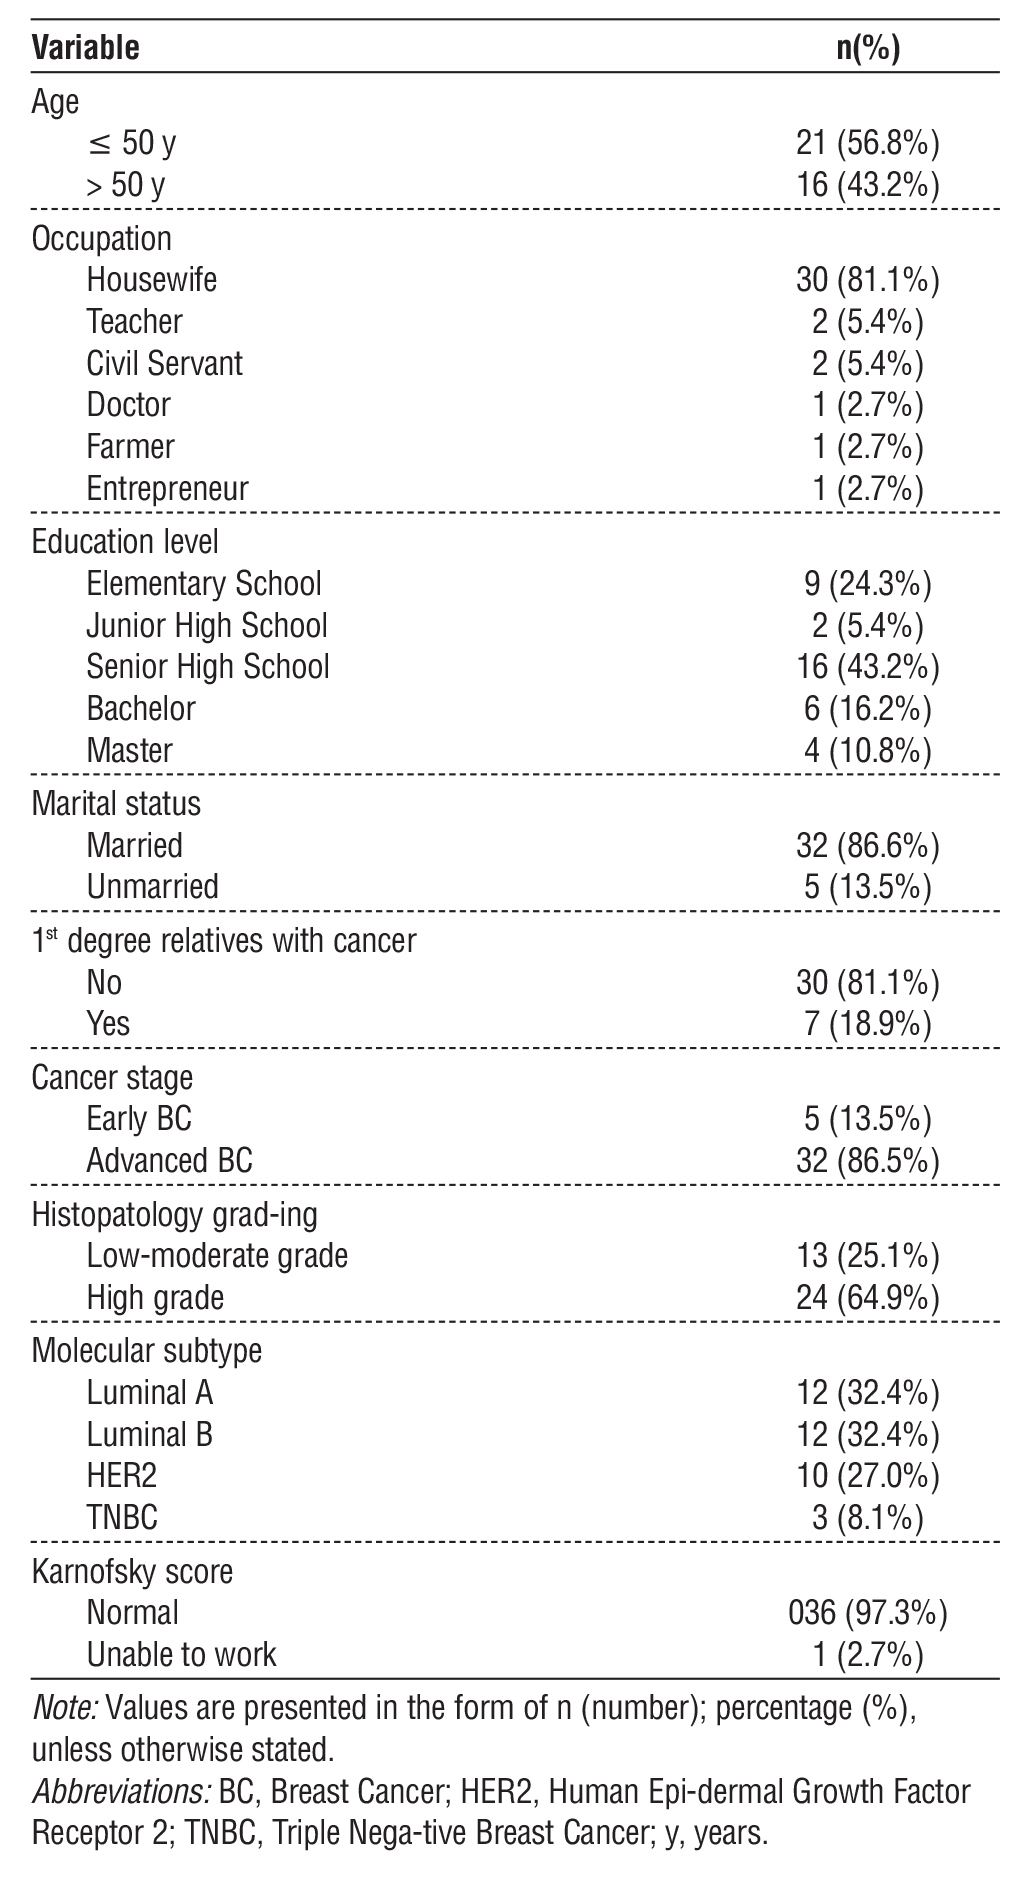
Table 1 - Baseline Characteristics of Respondents (n=37)
Ethical Approval
This study received ethical approval from the Research Ethics Committee of Hasanuddin University, under recommendation number 651/UN4.6.4.5.31/ PP36/2024. Prior to data collection, all participants were provided with detailed information regarding the study’s objectives, procedures, potential risks, and
benefits. Written informed consent was obtained from each participant. The research was conducted in full accordance with the ethical principles outlined in the Declaration of Helsinki, ensuring the rights, safety, confidentiality, and well-being of all participants were upheld throughout the study.
RESULTS
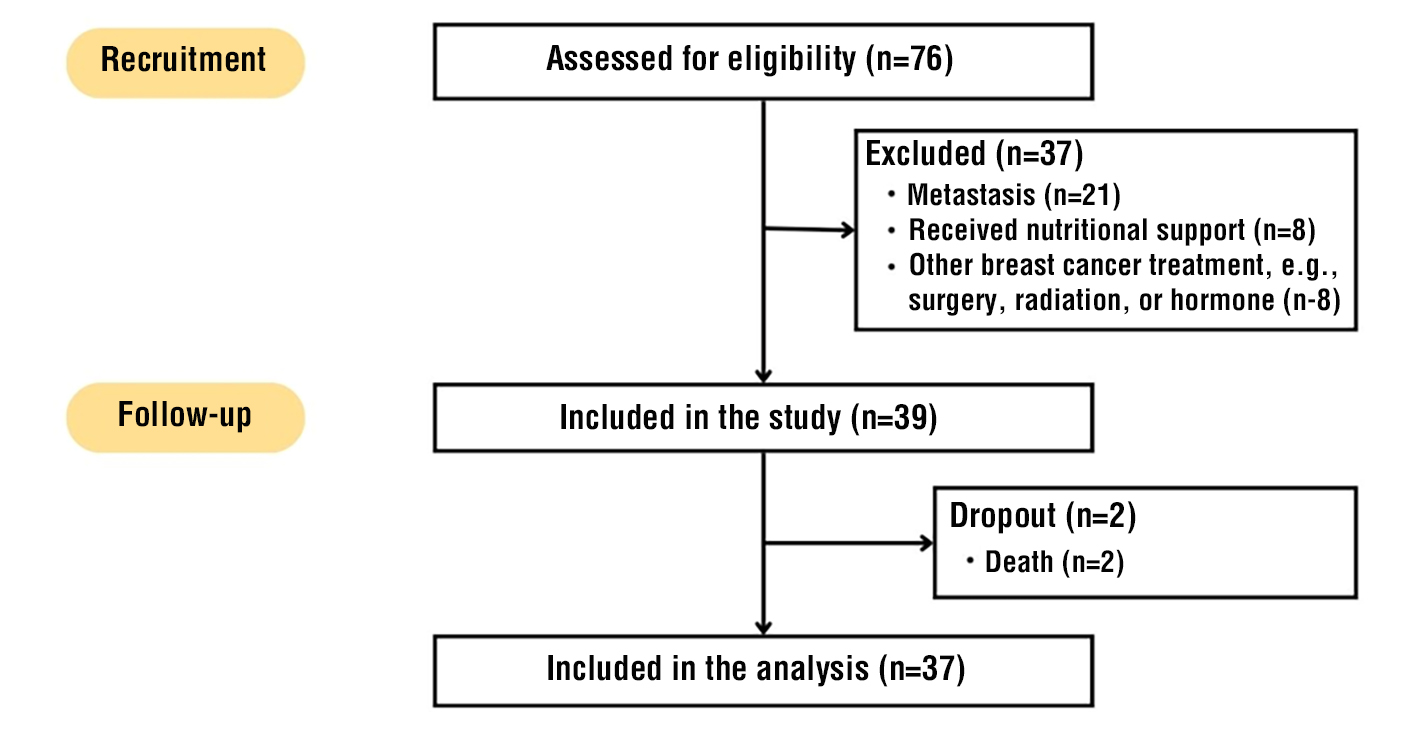
A total of 76 individuals were screened for eligibility for inclusion in the study. Of these, 37 were excluded based on the following criteria: metastasis (n=21), prior nutritional support (n=8), or prior administration of other breast cancer treatments, such as surgery, radiation, or hormone therapy (n=8) (fig. 1). Thus, 39 participants were enrolled in the study. During the follow-up period, two participants were withdrawn due to death, resulting in a final analytic sample of 37 subjects. The demographic and clinical characteristics of the study cohort are reported in table 1. Breast cancer patients mostly occur at the age of ?50 years. 43.2% of patients have a senior high school education. Merely a few patients are diagnosed with early-stage breast cancer; most are diagnosed at an advanced stage. Patients were mainly diagnosed with luminal tumor phenotype (64.8%).
Figure 1 - Flowchart of the Study
Participant Characteristics
Table 2 - Features of the study cohort pre- and post-chemotherapy
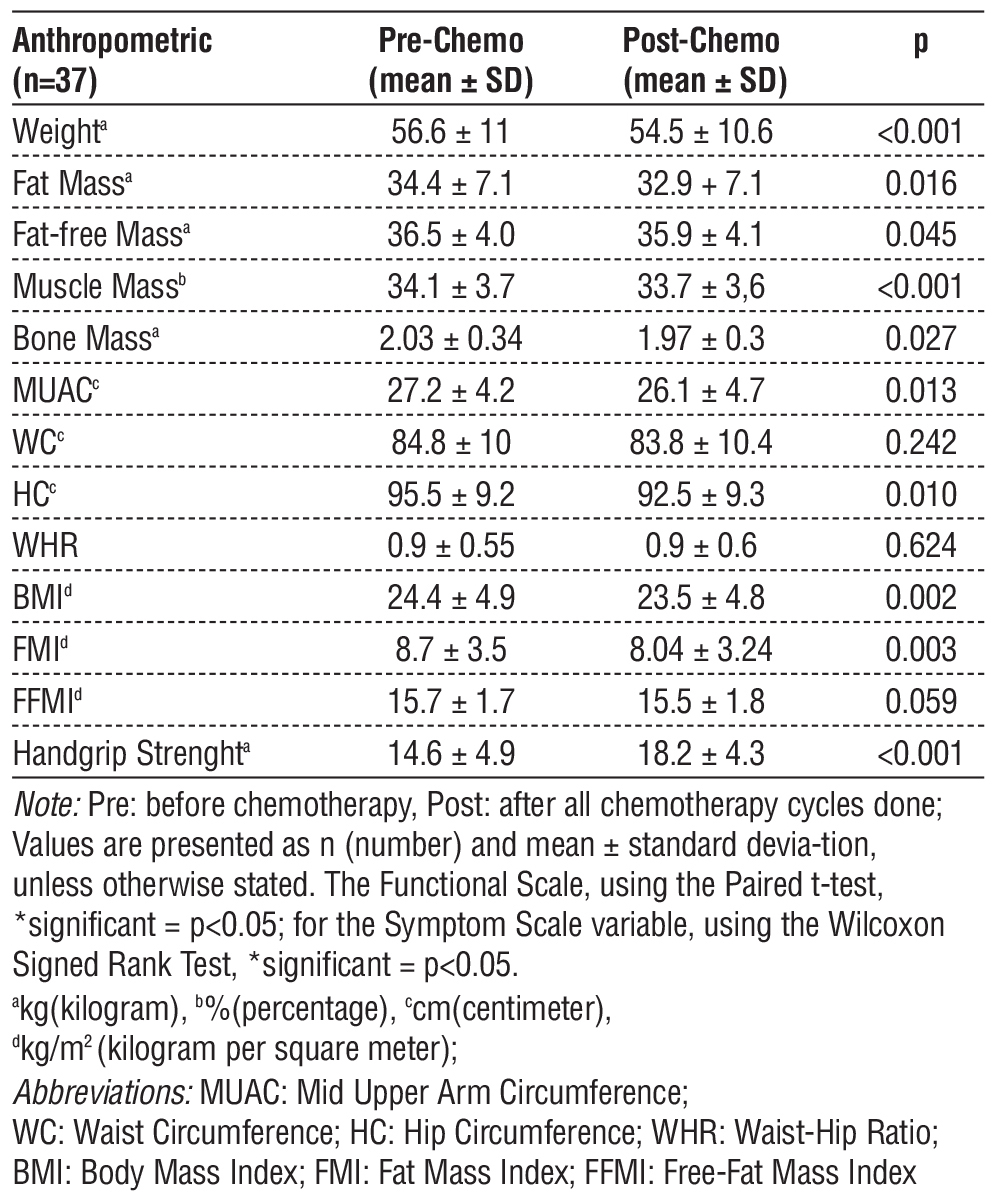
Table 2 summarizes a comprehensive comparison of anthropometric and functional parameters in thirtyseven breast cancer patients before and after chemotherapy. Chemotherapy was associated with significant decreases in body weight, fat mass, fat-free mass, muscle mass, bone mass, midupper arm circumference, hip circumference, body mass index, and fat mass index (all p < 0.05). Additionally, symptom scale and handgrip strength values increased significantly following treatment. Conversely, there were no significant changes in waist circumference, waisthip ratio, fat-free mass index, or functional scale scores. These findings underscore the profound impact of chemotherapy on both body composition and physical function, highlighting the necessity for integrated nutritional and rehabilitative interventions to support patient health throughout the treatment trajectory.
Table 3 - Mean values of the quality-of-life functional scale and symptom scale before and after chemotherapy
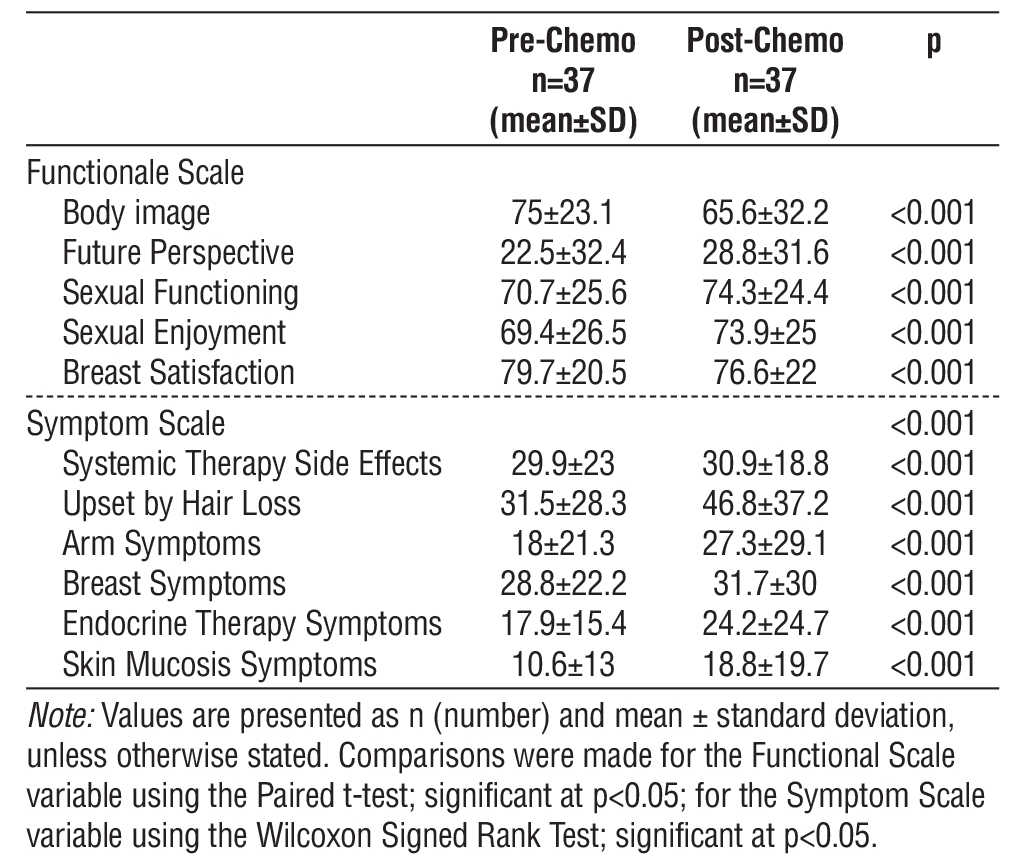
Table 3 provides a detailed comparison of functional and symptom scale scores in thirty-seven breast cancer patients before and after chemotherapy. Postchemo-therapy assessments show a significant decrease in body image and breast satisfaction, accompanied by improved scores for future perspective, sexual functioning, and sexual enjoyment (all p < 0.001) and regarding symptom scales, systemic therapy side effects, and most symptoms including those related to the arm, breast, endocrine therapy, and skin mucositis, exhibited higher scores following chemotherapy, indicating increased symptom burden. Notably, those upset due to hair loss showed the greatest increase in score after treatment. These findings illustrate the multifaceted impact of chemotherapy, affecting both patient quality of life and symptomatology, and underscore the need for supportive interventions that address psychological, physical, and psychosocial domains during treatment.
Figure 2 - Scatter Diagram between Delta Weight and Delta Functional Scale

Association of delta functional and delta symptoms scale and delta weight, BMI, FMI, FFMI
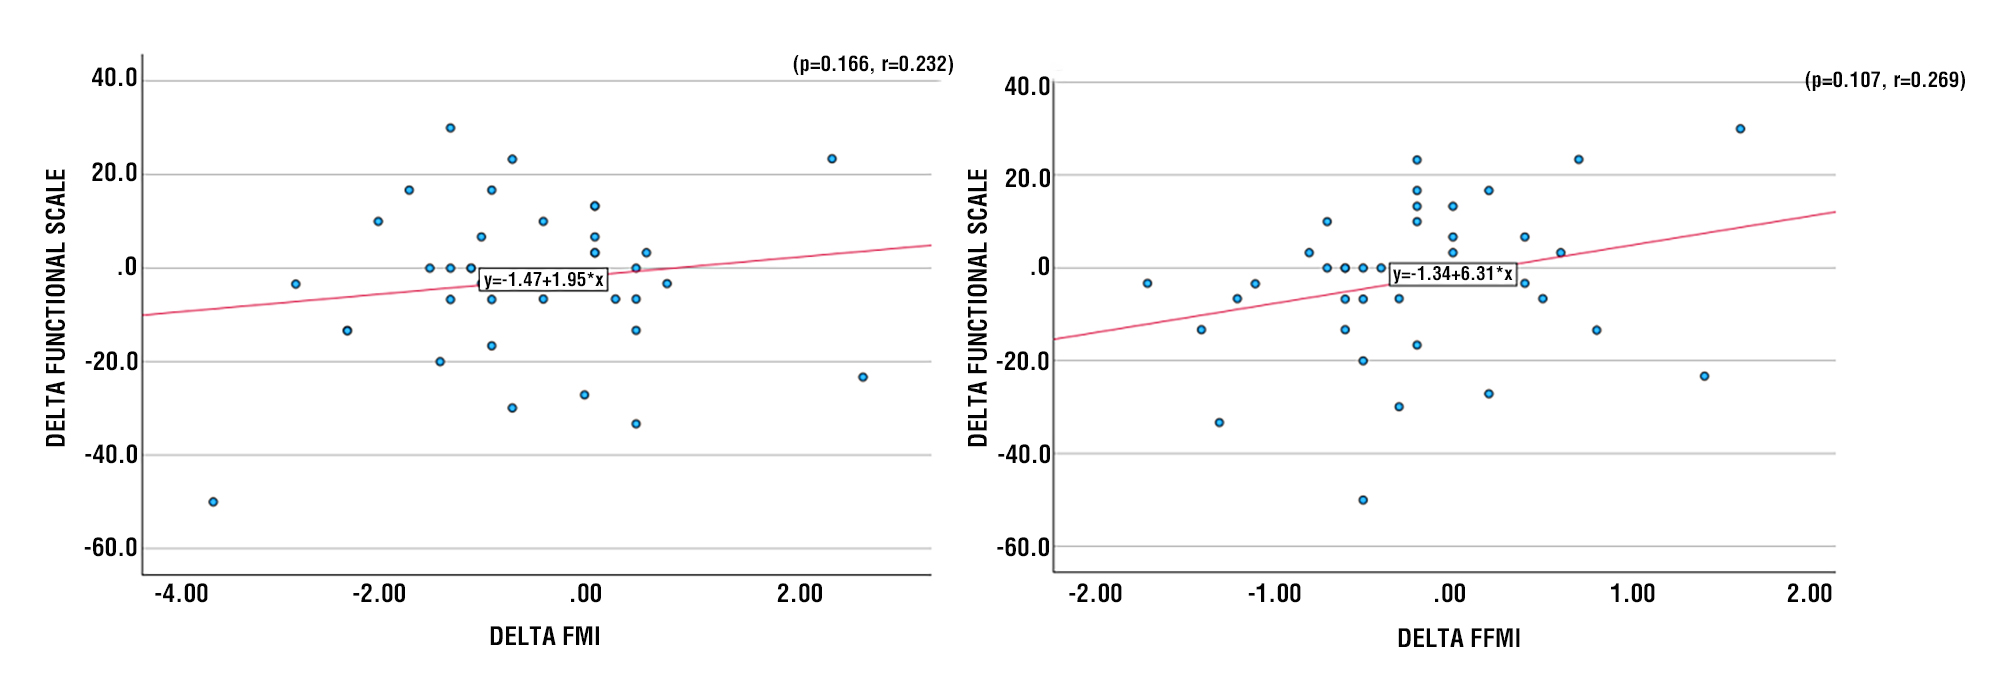
Figures 2-5 illustrate the associations between delta weight, BMI, FMI, and FFMI and the delta functional scale, based on Pearson’s correlation test and linear regression analyses. A positive correlation between changes in BMI and changes in Functional Scale after therapy (r2 0.054), which means that the greater the value of the change in BMI, the greater the value of the change in Functional Scale (p = 0.169). There is a tendency for a positive correlation between changes in FMI and changes in Functional Scale after therapy (r2=0.022), indicating that the greater the value of the change in FMI, the greater the value of the change in Functional Scale (p=0.166). There is a tendency for a positive correlation between changes in FFMI and changes in Functional Scale after therapy (r2=0.072), indicating that the greater the change in FFMI, the greater the change in Functional Scale (p=0.107).
Figure 3 - Scatter Diagram between Delta BMI and Delta Functional Scale
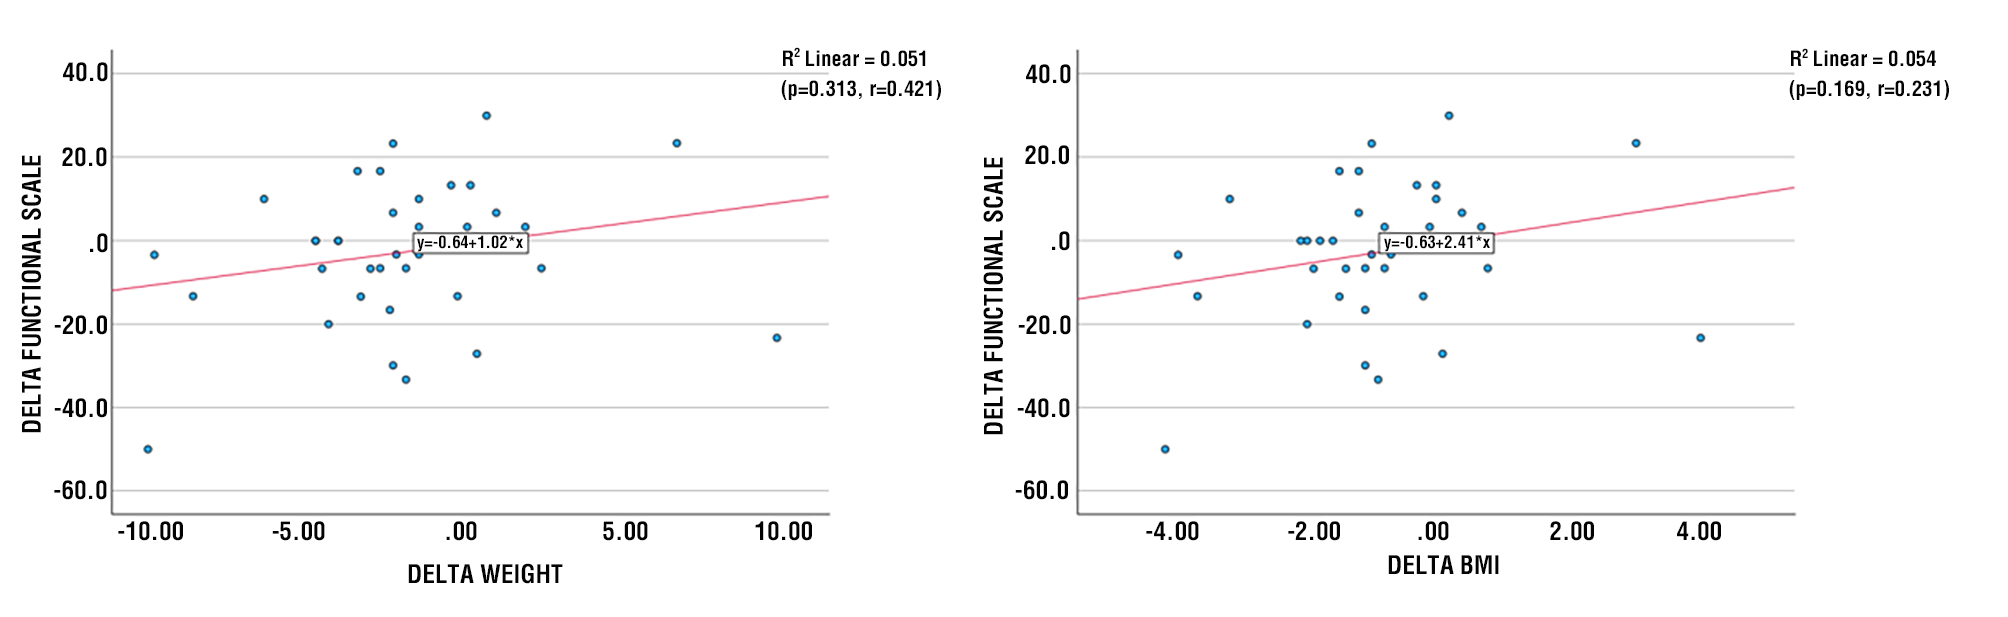
Figure 4 - Scatter Diagram between Delta FMI and Delta Functional Scale Figure 5 - Scatter Diagram between Delta FFMI and Delta Functional Scale
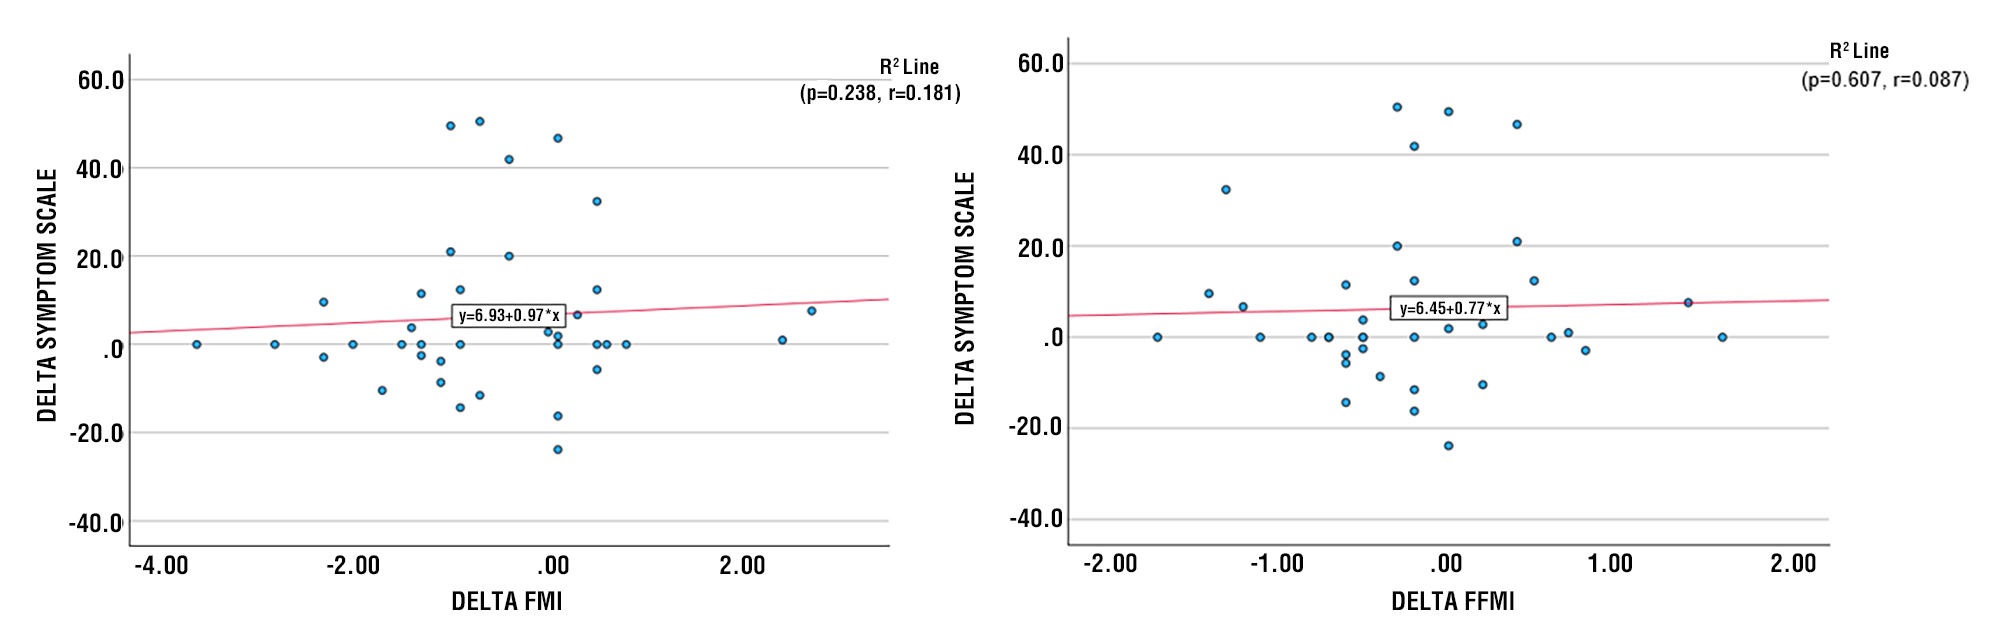
There is a positive correlation between changes in BMI and changes in the Symptom Scale after therapy (r2=0.008), indicating that the greater the change in BMI, the greater the change in the Symptom Scale (p=0.289). There is a tendency toward a positive correlation between changes in FMI and changes in the Symptom Scale after therapy (r2=0.005), indicating that the greater the change in FMI, the greater the change in the Symptom Scale (p=0.238). There is a positive correlation between changes in FFMI and changes in the Symptom Scale after therapy (r2=9.4), indicating that the greater the change in FFMI, the greater the change in the Symptom Scale (p=0.607) (fig. 6-9).
Figure 6 - Scatter Diagram between Delta Weight and Delta Symptoms Scale Figure 7 - Scatter Diagram between Delta BMI and Delta Symptoms Scale
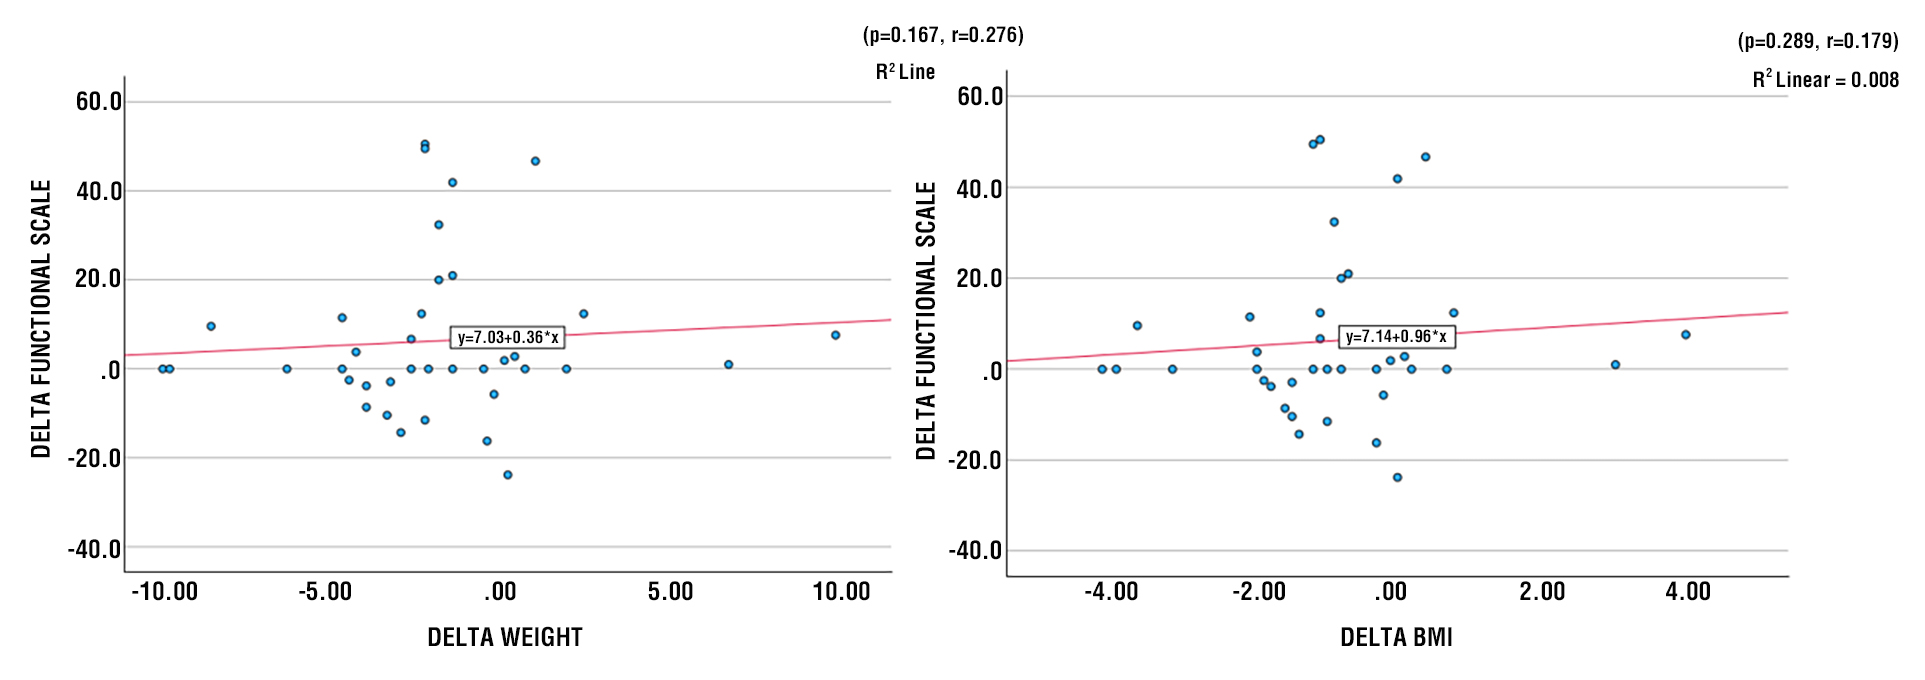
Figure 8 - Scatter Diagram between Delta FMI and Delta Symptoms Scale Figure 9 - Scatter Diagram between Delta FFMI and Delta Symptoms Scale
DISCUSSION
Chemotherapy significantly affects the nutritional status of breast cancer patients, leading to weight loss in 71% of participants. Key measurements, including body weight, BMI, triceps skin fold, and midarm muscle circumference, showed significant reductions during treatment (9). BMI is well-known to exhibit a
U-shaped association with all-cause mortality, indicating that both low and high BMI scores increase the risk of mortality (10). Research indicates that chemotherapy-related symptoms, such as loss of appetite and alterations in taste, contribute to weight loss and a decrease in BMI. A study found that BMI changes after chemotherapy showed 95% of breast cancer patients experienced weight changes, with many moving into the obese category posttreatment. Significant predictors of these changes included patient age and BMI at diagnosis (11). Another study indicated a mean weight loss of 6.99 kg and a BMI decrease of 2.72 kg/m² in women receiving multidisciplinary weight management postchemotherapy (12). Another study reported a similar trend, where BMI decreased significantly in patients undergoing anthracycline-based chemotherapy, accompanied by reductions in total body water and skeletal muscle mass (13).
Muscle loss, a significant constituent of FFM, has been reported to be associated with decreased physical function, reduced tolerance to anticancer therapy, and a worse survival outcome for patients with cancer (9). Chemotherapy with curative intent had a negative impact on body composition (14). In addition to changes in body weight, fat mass, and muscle mass in the overall sample, BMI and FMI were significantly impacted after chemotherapy, highlighting the importance of assessing body composition to monitor and implement strategies. Body composition changes during chemotherapy have been associated with treatment complications, chemotoxicity, time to tumor progression, and hospitalizations due to chemo-toxicity (15). Clinically, most patients were in an advanced stage (85,6%), associated with a high tumor load, which increases the risk of malnutrition due to increased catabolism (16). Most patients (64.9%) had high-grade tumors, indicating high malignancy and aggressiveness of the tumor. High-grade cancers exhibit significant metabolic alterations compared to normal cells and lower-grade cancers, primarily driven by their rapid growth and aggressive nature. These changes include increased glucose and glutamine uptake, enhanced glycolysis (even in the presence of oxygen, known as the Warburg effect), and altered lipid metabolism. These alterations are crucial for providing energy and building blocks, as well as for reducing the agents required for the survival and proliferation of cancer cells (17). Shen & Nzau (2022) found that Obesity was associated with worse outcomes in luminal A but not in luminal B subtype patients (18).
Various factors, including psychological, physical, and sociodemographic aspects, influence the quality of life (QoL) in breast cancer patients (19). The EORTC QLQ-BR45 questionnaire assesses quality of life in breast cancer patients, focusing on factors such as body image, sexual functioning, and endocrine-related sexual symptoms, revealing significant impacts on these domains, particularly in patients with organ failures (20). Mirjana (2022) found that body composition significantly impacts certain quality of life (QoL) subdomains during treatment (21). A low FFMI score was associated with all-cause mortality in patients with cancer, especially for older adults with cancer (8). A study by Adam (2023) also reported that initial nutritional status was not always directly correlated with functional scales, presumably due to the complexity of psychosocial factors (22). Hirosaki (2013) stated that patients with low levels of education tend to experience decreased functional quality of life; however, this was not observed in this study, likely due to the homogeneity of the sample (23). Although not significant, the decline in functional scores (from 70.01 to 67.21) should be considered as a potential indication of adaptation disorders or chronic fatigue. Psychosocial interventions (counseling, group therapy) and nutritional education are recommended to maintain functional quality of life during chemotherapy. Chemotherapy causes damage to healthy, rapidly dividing cells, such as gastrointestinal epithelial cells, which triggers nausea, vomiting, mucositis, and diarrhea (24). These symptoms are reflected in the symptomatic scale (eg, sore mouth, changes in food taste). Hair loss (alopecia) is a common side effect of chemotherapy that contributes to an increase in symptom scores. A study by Bjelic-Radisic (2020) found that alopecia significantly impacts patients' quality of life (7). Chemo-therapy triggers the release of proinflammatory cytokines, such as IL-6 and TNF-?, which worsen symptoms including pain, fever, and fatigue (25). This is reflected in questions related to breast pain and joint stiffness. Psychological stress due to a cancer diagnosis and the side effects of treatment increases symptoms such as headaches, mood swings, and sleep disturbances (22). The significant increases in postchemo-therapy symptomatic scales observed in this study are due to multiple factors. Proactive nutritional interventions, effective management of side effects, and psychological support are necessary to mitigate these impacts and enhance patient quality of life. This study found that changes in functional scale values ranged from -30.0 (increased) to 50.0 (decreased). The average change on the Functional Scale was 2.80 (decreased), representing a 4.0% decrease after chemotherapy. Changes in Symptoms Scale values varied between -50.5 (increased) and 23.8 (decreased). The average change on the Functional Scale was -6.27 (decreased), representing a 32.6% decrease after chemotherapy. Despite temporary side effects during treatment, several studies have shown significant improvements in physical, role, and social functioning domains after completing chemotherapy cycles. In contrast, Zieli?ska-Wi?czkowska & Bet?akowski (2010) found that chemotherapy significantly worsens the quality of life in cancer patients (26) with lower health parameters and increased symptoms, particularly nausea. The diagnosis itself also severely impacts quality of life, with emotional functioning being notably affected during treatment.
This multicenter prospective cohort study conducted serial assessments of body composition and quality of life in breast cancer patients before and after chemo-therapy, enabling a comprehensive longitudinal evaluation across multiple treatment cycles. The use of standardized and validated instruments, including bioelectrical impedance analysis and the EORTC QLQ-BR45 questionnaire, ensured rigorous and reliable measurement of both nutritional status and patient-reported outcomes. The systematic and detailed collection of anthropometric, functional, and quality-of-life data from a clinically heterogeneous cohort strengthens the methodological robustness. It enhances the external validity of the study’s findings in similar clinical settings.
The principal limitations of this investigation include its observational cohort design, which precludes definitive causal inference, and the limited sample size, which may constrain both statistical power and the generalizability of the findings. Moreover, the lack of stratification by chemotherapy regimen and the use of a generic quality-of-life instrument that did not specifically address BMI, FMI, or FFMI may reduce the sensitivity for detecting meaningful associations. Additionally, the potential influence of unmeasured confounding variables - such as individual psychological profiles, coping mechanisms, social and marital status, and support systems - was not fully accounted for, which could affect the observed outcomes.
In light of the findings, clinical and public health strategies should prioritize appropriate nutritional management and supportive care to help patients mitigate these adverse effects, potentially improving their overall treatment experience and outcomes. This highlights the importance of integrating nutritional support into cancer care protocols. Moreover, while integrating nutritional support is crucial, challenges such as financial constraints and a lack of trained professionals persist. Addressing these barriers is vital to ensuring equitable access to nutritional care, a fundamental aspect of comprehensive cancer treatment.
Future Research should employ larger cohorts and rigorously designed intervention studies to directly examine how changes in BMI, FMI, and FFMI affect quality of life, thereby providing further clarity on these associations and informing evidence-based best practices for supportive oncology care.
CONCLUSION
This prospective cohort study found that alterations in body composition parameters - specifically body mass index (BMI), fat mass index (FMI), and fat-free mass index (FFMI) - were not significantly associated with quality-of-life outcomes in breast cancer patients undergoing chemotherapy. Although chemotherapy induced notable adverse changes in nutritional status and body composition, these modifications did not correspond to meaningful differences in quality of life as measured by the EORTC QLQ-BR45 questionnaire. These results underscore the multifactorial nature of patient-reported outcomes during chemotherapy, suggesting that the interplay between body composition and quality of life is complex and likely mediated by additional psychosocial, clinical, and demographic factors.
Acknowledgments
The authors would like to express their sincere appreciation to Hasanuddin University Teaching Hospital, RSUP Dr. Wahidin Sudirohusodo General Hospital, and the Department of Clinical Nutrition at Universitas Hasanuddin for their valuable assistance with patient recruitment and data collection. Deep gratitude is also extended to the supervisors, research team, healthcare professionals, the patients, and their families who participated in this study. The authors further acknowledge the constructive input provided by colleagues and manuscript reviewers.
Conflict of Interest
All authors have no conflicts of interest that are directly relevant to the content of this review.
Funding
No sources of funding were used to conduct this review. No relevant financial or other relationship to disclose.
REFERENCES
1. Siegel RL, Miller KD, Fuchs HE, Jemal A. Cancer statistics, 2022. CA Cancer J Clin. 2022;72(1):7-33.
2. Prihantono, Rusli R, Christeven R, Faruk M. Cancer Incidence and Mortality in a Tertiary Hospital in Indonesia: An 18-Year Data Review. Ethiop J Health Sci. 2023;33(3):515-522.
3. Gupta MrsDK. Chemotherapy of Malignancy-II. In: Edited Book of Pharma-cology-III [According to Latest Syllabus of B. Pharm-VI Semester of Pharmacy Council of India]. Iterative International Publishers, Selfypage Developers Pvt Ltd; 2024. p. 151–159.
4. Godinho-Mota JCM, Vaz-Gonçalves L, Dias Custódio ID, Schroeder de Souza J, Mota JF, Gonzalez MC, et al. Impact of Chemotherapy Regimens on Body Composition of Breast Cancer Women: A Multicenter Study across Four Brazilian Regions. Nutrients. 2023;15(7):1689.
5. Guðmundsson GH, Jóhannsson E. Þrek, holdafar og heilsutengd lífsgæði eftir krabbameinsmeðferð. Læknablaðið. 2020;2020(04): 179–186.
6. Sun SS, Chumlea WC, Heymsfield SB, Lukaski HC, Schoeller D, Friedl K, et al. Development of bioelectrical impedance analysis prediction equations for body composition with the use of a multicomponent model for use in epidemiologic surveys. Am J Clin Nutr. 2003;77(2):331-40.
7. Bjelic-Radisic V, Cardoso F, Cameron D, Brain E, Kuljanic K, da Costa RA, et al. An international update of the EORTC questionnaire for assessing quality of life in breast cancer patients: EORTC QLQ-BR45. Ann Oncol. 2020;31(2):283-288.
8. Ionescu (Miron) AI, Anghel AV, Antone-Iordache IL, Atasiei DI, Anghel CA, Barnonschi AA, et al. Assessing the Impact of Organ Failure and Metastases on Quality of Life in Breast Cancer Patients: A Prospective Study Based on Utilizing EORTC QLQ-C30 and EORTC QLQ-BR45 Questionnaires in Romania. J Pers Med. 2024; 14(2):214.
9. Talima S, Nabil L, El-Meghawry M. Effect of Chemotherapy on the Nutritional Status of Egyptian Patients with Breast Cancer. Research in Oncology. 2016;12(2):47–53.
10. Bhaskaran K, dos-Santos-Silva I, Leon DA, Douglas IJ, Smeeth L. Association of BMI with overall and cause-specific mortality: a population-based cohort study of 3·6 million adults in the UK. Lancet Diabetes Endocrinol. 2018;6(12):944-953.
11. Ali H, Al-Tawri E. Body Weight Changes in 210 Breast Cancer Patients after Finishing Chemotherapy; Cross Sectional Study. The Medical Journal of Basrah University. 2020;38(2):120–126.
12. Nguyen J, Popovic M, Chow E, Cella D, Beaumont JL, Chu D, et al. EORTC QLQ-BR23 and FACT-B for the assessment of quality of life in patients with breast cancer: a literature review. J Comp Eff Res. 2015;4(2):157-66.
13. Rachmawati I, Yohana R, Amam B, Zuhairini Y. Reduced body mass index but not fat mass in anthracycline-based chemo-therapy of locally advanced breast cancer patients. IJCNP (Indonesian Journal of Clinical Nutrition Physician). 2023;6(1):33-37.
14. Godinho-Mota JCM, Mota JF, Gonçalves LV, Soares LR, Schincaglia RM, Prado CM, et al. Chemotherapy negatively impacts body composition, physical function and metabolic profile in patients with breast cancer. Clin Nutr. 2021;40(5):3421-3428.
15. Klassen O, Schmidt ME, Ulrich CM, Schneeweiss A, Potthoff K, Steindorf K, et al. Muscle strength in breast cancer patients receiving different treatment regimes. J Cachexia Sarcopenia Muscle. 2017;8(2):305-316.
16. Prediction of Malnutrition and the Relationships Among Pain, Function, De-pression, and Cancer Stage in Older Women With Breast Cancer. Clin J Oncol Nurs. 2023;27(4):411-417.
17. Chen S, Li S, Wang Y, Chen Z, Wang H, Zhang XD. Gold Nanoclusters for Tumor Diagnosis and Treatment. Adv. NanoBiomed Res. 2023;3(12):2300082.
18. Tong Y, Zhu S, Chen W, Chen X, Shen K. Association of Obesity and Luminal Subtypes in Prognosis and Adjuvant Endocrine Treatment Effectiveness Predic-tion in Chinese Breast Cancer Patients. Front Oncol. 2022;12:862224.
19. de Kruif AJt, Westerman MJ, Winkels RM, Koster MS, van der Staaij IM, van den Berg MMGA, et al. Exploring changes in dietary intake, physical activity and body weight during chemotherapy in women with breast cancer: A Mixed-Methods Study. J Hum Nutr Diet. 2021; 34(3):550-561.
20. Fallah A, Parnian K, Abdolazimi H, Tezerji S, Mazloom Z. The Effects of Indi-vidual Diet Therapy on Food Intake, Quality of Life, and Related Serum Proteins in Patients with Breast Cancer: A Randomized Clinical Trial. Basic & Clinical Cancer Research, 2020; 12(3):140 -152
21. Pavlovi? Mavi? M, Šeparovi? R, Vazdar L, Te?i? Vuger A, Banovi? M. Impact of Body Composition on the Quality of Life of Premenopausal Patients with Early Stage Breast Cancer During Chemotherapy. Acta Clin Croat. 2022;61(4):605-612.
22. Adam R, Haileselassie W, Solomon N, Desalegn Y, Tigeneh W, Suga Y, et al. Nutritional status and quality of life among breast Cancer patients undergoing treatment in Addis Ababa, Ethiopia. BMC Womens Health. 2023;23(1):428.
23. Hirosaki M, Ishimoto Y, Kasahara Y, Konno A, Kimura Y, Fukutomi E, et al. Positive affect as a predictor of lower risk of functional decline in community-dwelling elderly in <scp>J</scp> apan. Geriatr Gerontol Int. 2013;13(4):1051-8.
24. Anand U, Dey A, Chandel AKS, Sanyal R, Mishra A, Pandey DK, et al. Cancer chemotherapy and beyond: Current status, drug candidates, associated risks and progress in targeted therapeutics. Genes Dis. 2022;10(4):1367-1401.
25. Wang M, Zhang J, Wu Y. Tumor metabolism rewiring in epithelial ovarian cancer. J Ovarian Res. 2023;16(1):108.
26. Zieli?ska-Wi?czkowska H, Bet?akowski J. Quality of life in cancer patients un-dergoing chemotherapy. Wspó?czesna Onkologia. 2010;4:276-280.
Full Text Sources:
Abstract:
Views: 1112

For Authors
Journal Subscriptions

Dec 2025
Supplements
Instructions for authors
Online submission
Contact
e-ISSN: 2601 - 1700 (online)
ISSN-L: 2559 - 723X
Journal Abbreviation: Surg. Gastroenterol. Oncol.
Surgery, Gastroenterology and Oncology (SGO) is indexed in:
- SCOPUS
- EBSCO
- DOI/Crossref
- Google Scholar
- SCImago
- Harvard Library
- Open Academic Journals Index (OAJI)
Surgery, Gastroenterology and Oncology (SGO) is an open-access, peer-reviewed online journal published by Celsius Publishing House. The journal allows readers to read, download, copy, distribute, print, search, or link to the full text of its articles.
Time to first editorial decision: 25 days
Rejection rate: 61%
CiteScore: 0.2

Meetings and Courses in 2025
Meetings and Courses in 2024
Meetings and Courses in 2023
Meetings and Courses in 2022
Meetings and Courses in 2021
Meetings and Courses in 2020
Meetings and Courses in 2019
Verona expert meeting 2019

Surgery, Gastroenterology and Oncology applies the Creative Commons Attribution Non Commercial (CC BY-NC 4.0) license, which permits readers to copy and redistribute the material in any medium or format, remix, adapt, build upon the published works non-commercially, and license the derivative works on different terms, provided the original material is properly cited and the use is non-commercial. Please see: https://creativecommons.org/licenses/by-nc/4.0/
Publisher’s Note:
The opinions, statements, and data contained in article are solely those of the authors and not of Surgery, Gastroenterology and Oncology journal or the editors. Publisher and the editors disclaim responsibility for any damage resulting from any ideas, instructions, methods, or products referred to in the content.