Surgery, Gastroenterology and Oncology

|
|
Background: Celiac disease (CD) is a chronic immune-mediated disorder that is triggered by gluten ingestion in genetically susceptible individuals. It is characterized by intestinal inflammation and dysregulation of immune tolerance. This study aimed to assess the regulatory role of miRNA-31-5P in the expression of FOXP3 in patients with Iraqi celiac disease and compare it with that in healthy individuals.
Methods: This case-control study included 60 patients with celiac disease (22 males and 38 females) and 60 healthy controls. The study participants were recruited between October 2025 and January 2026 from the Al-Yarmouk Teaching Hospital, Baghdad, Iraq. Serum levels of tTG-IgA and tTG-IgG were quantified using enzyme-linked immunosorbent assay (ELISA). RNA extraction was then performed. cDNA synthesis was performed, and Quantitative Real-Time PCR (qRT-PCR) was used for analysis.
Results: The study showed FOXP3 expression was higher in CD patients than in controls (4.31 ± 0.42 vs. 1.22 ± 0.09); however, this difference was not statistically significant (p > 0.05), and MIR31-5P expression was significantly reduced in CD patients compared to controls (0.73 ± 0.18 vs. 1.16 ± 0.09, p < 0.05). Serological analysis revealed markedly elevated levels of tTG-IgA in CD patients compared to controls (230.09 ± 12.29 vs. 5.04 ± 0.92, at p < 0.001). Similarly, tTG-IgG levels were significantly higher in CD patients than in controls (156.15 ± 14.41 vs. 7.76 ± 2.07, at p < 0.001).
Conclusion: These findings highlight immunological and serological differences between patients with CD and healthy subjects. Expression of MIR31-5P was significantly decreased and levels of tTG-IgA and tTG-IgG were greatly increased in patients with CD compared to those in healthy controls. These results suggest a crucial role for miRNA-mediated immune regulation in the development of CD.
Keywords: celiac disease, gene expression, MicroRNA, immunity
Introduction
Celiac disease (CD) is an inflammatory disease of the small intestine that affects at least 1 % of the world’s population, with increasing incidence, particularly in children (1). CD is a frequent autoimmune disorder that is initiated by gluten burden in genetically predisposed individuals (2). It commonly presents with diverse gastric symptoms including diarrhea, malabsorption, and weight loss resulting from the ingestion of cereals containing gluten (3). Some patients receive medical attention with extraintestinal symptomatology, without GI complaints, or noted incidentally through screening, which is triggered by a positive family history (4). Demographic studies have shown that this widespread illness is becoming more prevalent worldwide. The genetic and environmental variables that contribute to CD pathogenesis are complicated (5). The pathogenesis of celiac disease is multifactorial and results from interactions between genetic, environmental, and immunological factors. Genetic predisposition is highly concentrated within the presence of HLA-DQ2 and HLA-DQ8 haplotypes, but the mere presence of these alleles is not enough to develop the disease, which suggests that additional molecular mechanisms participate in disease induction and progression. Immune dysregulation is a key component in the loss of tolerance to food antigens (6). Loss of tolerance toward gluten is central to the pathogenesis of tolerance toward gluten. The immune tolerance of dietary antigens under normal conditions is tightly controlled to prevent the overactivation of inflammatory responses. In patients with celiac disease, this balance is disturbed, leading to the activation of gluten-specific CD4 + T lymphocytes and the production of pro-inflammatory cytokines and autoantibodies such as anti–tissue transglutaminase (tTG) antibodies. Immune dysregulation results in chronic inflammation and mucosal injury (7).
Regulatory T cells (Tregs) are essential mediators of immune tolerance and play a crucial role in suppressing excessive immune responses (8). These cells are necessary for the maintenance of peripheral tolerance to self- and non-self-antigens such as food constituents. The transcription factor forkhead box P3 (FOXP3) is essential for Treg cell development, differentiation, and suppressor function (9). Dysfunction of FOXP3 expression or functions can lead to defective regulatory T cell function and the occurrence of autoimmune and inflammatory diseases. MicroRNAs (miRNAs) are key post-transcriptional gene regulators that play important roles in immune regulation (10). Of the immune-related miRNAs, microRNA-31-5P (miRNA-31) has been reported to be involved in immunity and inflammatory signaling. It has been documented that miRNA-31-5P may affect T cell differentiation and function, and it has been suggested to be a negative regulator of FOXP3 expression. Based on this interaction, the abnormal expression of miRNA-31-5P may participate in the inhibition of Treg function and immune bias (11). Celiac subjects from Iraq are understudied at the molecular and immune level. Thus, exploring miRNA-mediated regulation of FOXP3 expression in this population could not only shed light on disease pathogenesis but also provide insights into the unique immune mechanism in ethnic Chinese. Consequently, the aim of this study was to analyze the regulatory effects of miRNA-31-5P on FOXP3 gene expression in a group of Iraqi patients with celiac disease and compare them with a healthy control group, and to explore the potential role of miRNA-31-5P as a molecular marker associated with immune dysregulation.
Methods
Study Design and Participants
This case-control study was conducted as a case-control study and among 60 celiac disease (22 males and 38 females) and 60 healthy controls. The study groups were recruited from Al-Yarmouk Teaching Hospital, Baghdad-Iraq, in cooperation with the Institute of Genetic Engineering and Biotechnology for Postgraduate Studies/University of Baghdad. Celiac disease was diagnosed based on clinical and serologic assessments.
Inclusion Criteria
Participants in all age groups diagnosed with celiac disease were included in the study. The diagnosis was confirmed by a specialist physician based on clinical symptoms, positive serological markers (e.g., anti-tTG IgA), and/or intestinal biopsy results. No specific age range was set, and both children and adults were enrolled in the study. For the child participants, written informed consent was obtained from their legal guardians. All participants were of Iraqi nationality, residing in Iraq at the time of the study, and had no recent history of immunosuppressive therapy in the past three months.
Exclusion Criteria
Exclusion criteria for both the patients and those in the control group were any history of gastrointestinal illness, other autoimmune disorders, or associated chronic inflammatory bowel disease, such as Crohn’s disease or ulcerative colitis, as well as forms of chronic renal and liver diseases or bowel tumors.
Ethical Considerations
This study was conducted according to the ethical standards stipulated in the Declaration of Helsinki, and the study protocol was approved by the Ethics Committee of the Institute of Genetic Engineering and Biotechnology for Postgraduate Studies, University of Baghdad. Written informed consent was obtained from all participants prior to sample collection. All procedures were performed in accordance with ethical standards for human research.
Sample Collection
Venous blood samples (5 mL) were collected from each participant under aseptic conditions. Two milliliters were transferred into ethylenediaminetetraacetic acid (EDTA) tubes for RNA extraction, and 3 mL was placed into gel tubes for serum separation. Samples were centrifuged at 1500 rpm for 10 min, labelled, and stored at −20°C until immunological and molecular analyses.
RNA Extraction
Total RNA was extracted from whole blood samples using a TransZol Up Plus RNA kit (TransGen Biotech, China). For each sample, 250 µL of EDTA blood was mixed with 750 µL of TRIzol reagent in a sterile Eppendorf tube to initiate cell lysis and stabilize the RNA. The lysed samples were stored at −20°C until extraction procedure was performed. RNA was isolated according to the manufacturer’s protocol. RNA concentration and purity were assessed using a NanoDrop 2000c spectrophotometer, and all samples showed acceptable A260/A280 ratios within the recommended purity range.
cDNA Synthesis
cDNA was synthesized from the extracted RNA using the Easy Script® One-Step gDNA Removal and cDNA Synthesis Super Mix according to the manufacturer’s instructions. Each reaction was prepared in a final volume of 20 µL, containing 4 µL RNA as the template. The reverse transcription program included the following steps:25°C for 10 min to remove genomic DNA removal,42°C for 15 min for reverse transcription and85°C for 5 min to inactivate the enzyme.
Primers Preparation
Lyophilized primers used for MiRNA31-5P, FOXP3, and Glyceraldehyde 3-phosphate dehydrogenase (GAPDH) were reconstituted in nuclease-free water according to the manufacturer’s instructions to obtain 100 µM stock solutions. Diluting 10µL of each primer stock solution in 90µL of nuclease-free water yielded a working solution with a concentration of 10µM, which was maintained at (-20°C) until use.
Quantitative Real-Time PCR (qRT-PCR)
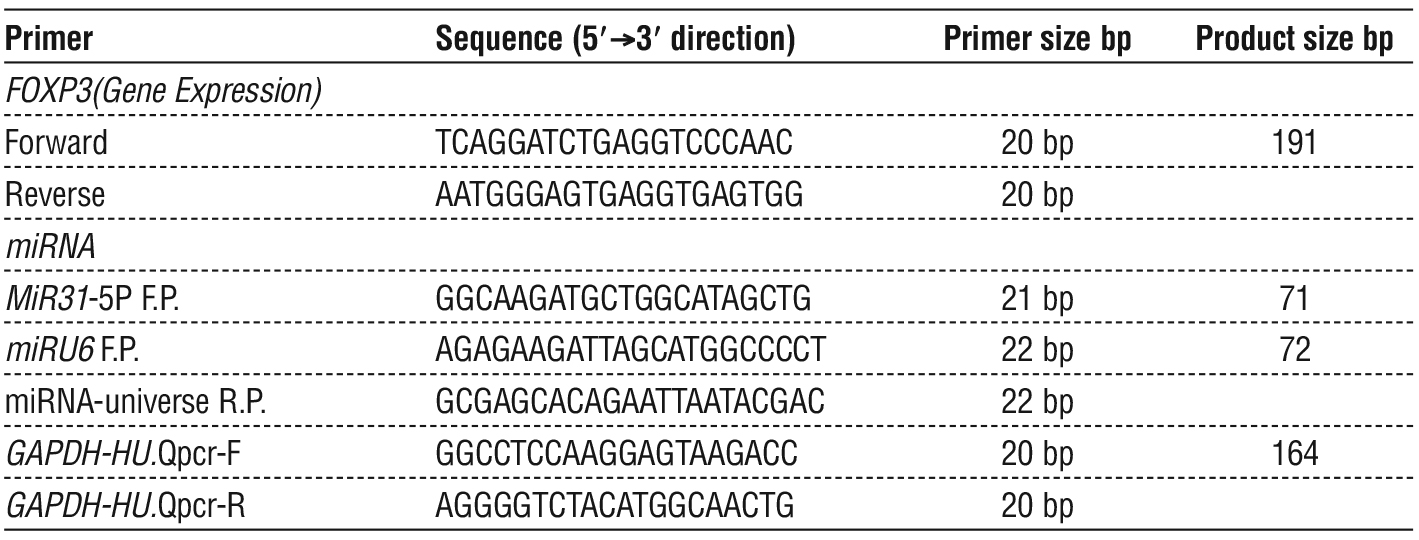
Quantitative real-time PCR was performed to measure the expression levels of MiRNA31-5P and FOXP3, and GAPDH using the Rotor-Gene Q real-time PCR system and Trans Start® Top Green qPCR Super Mix. Each reaction was prepared in a final volume of 20 µL, containing qPCR master mix, primers, nuclease-free water, and cDNA template. The amplification protocol consisted of an initial denaturation at 94 °C, followed by 40 cycles of denaturation at 94°C (denaturation), annealing at 58°C (annealing), and extension at 72°C (extension). Melt-curve analysis was performed from 55 °C to 95°C to confirm the specificity of the amplified products. Primer sequences used in this study are listed in table 1.
Table 1 - Primer sequences used for qRT-PCR.
Assessment of tTg-IgA, and tTg IgG
Assessment of anti-tissue transglutaminase antibodies, including tTG-IgA and tTG-IgG, was performed in all patients with CD and healthy subjects. Serum levels of tTG-IgA and tTG-IgG were measured using commercially available ELISA kits (Fine Test, China) following the manufacturer’s instructions.
Gene Expression Calculation
Relative expression levels of MiRNA31-5P, FOXP3, and GAPDH were calculated using the 2−ΔΔCt method originally published by Livak and Schmittgen (2001). Double-delta Ct (threshold cycle) analysis was used to assess the expression of FOXP3 and miRNA31-5P genes, in which GAPDH and miRNAU6 were the housekeeping reference genes. The calculations were as follows:
ΔCT = CT target gene – CT of reference gene ... Eq. 1
ΔΔCT= ΔCT of each sample − average control ΔCT Eq. 2
Folding change = 2-ΔΔCt …………………………........... Eq.3
Statistical Analysis
Statistical analyses were performed using SPSS version 22. Data are presented as mean ± standard deviation (SD). Data normality was assessed prior to analysis to ensure the appropriateness of the statistical tests. Differences between groups were evaluated using the independent sample t-test, and a p-value < 0.05 was considered statistically significant (12).
Results
Figure 1a shows the FOXP3 fold changes in patients with celiac disease compared to the control groups. The results are expressed as (mean ± SE). The results indicated that the mean FOXP3 level in the patient group was 4.31 ± 0.42, compared to the control group 1.22 ± 0.09. The results indicated that there were no statistically significant differences, with a probability value of p > 0.05.
Figure 1b show FOXP3 fold levels by sex in the two groups of patients with celiac disease and control groups. In the patient group, the mean FOXP3 level was 3.91 ± 0.66 in males and 4.57 ± 0.55 in females, with a p-value > 0.05. In the control group, the mean FOXP3 level was 1.43 ± 0.15 in males and 1.10 ± 0.11 in females, with no statistically significant difference between the sexes (p > 0.05). Furthermore, comparisons between patients and controls within each sex showed no statistically significant differences (p > 0.05) in all comparisons.
Figure 1 - FOXP3 expression levels (fold change): (a) comparison between CD patients and control group; (b) comparison between patients and controls according to sex.
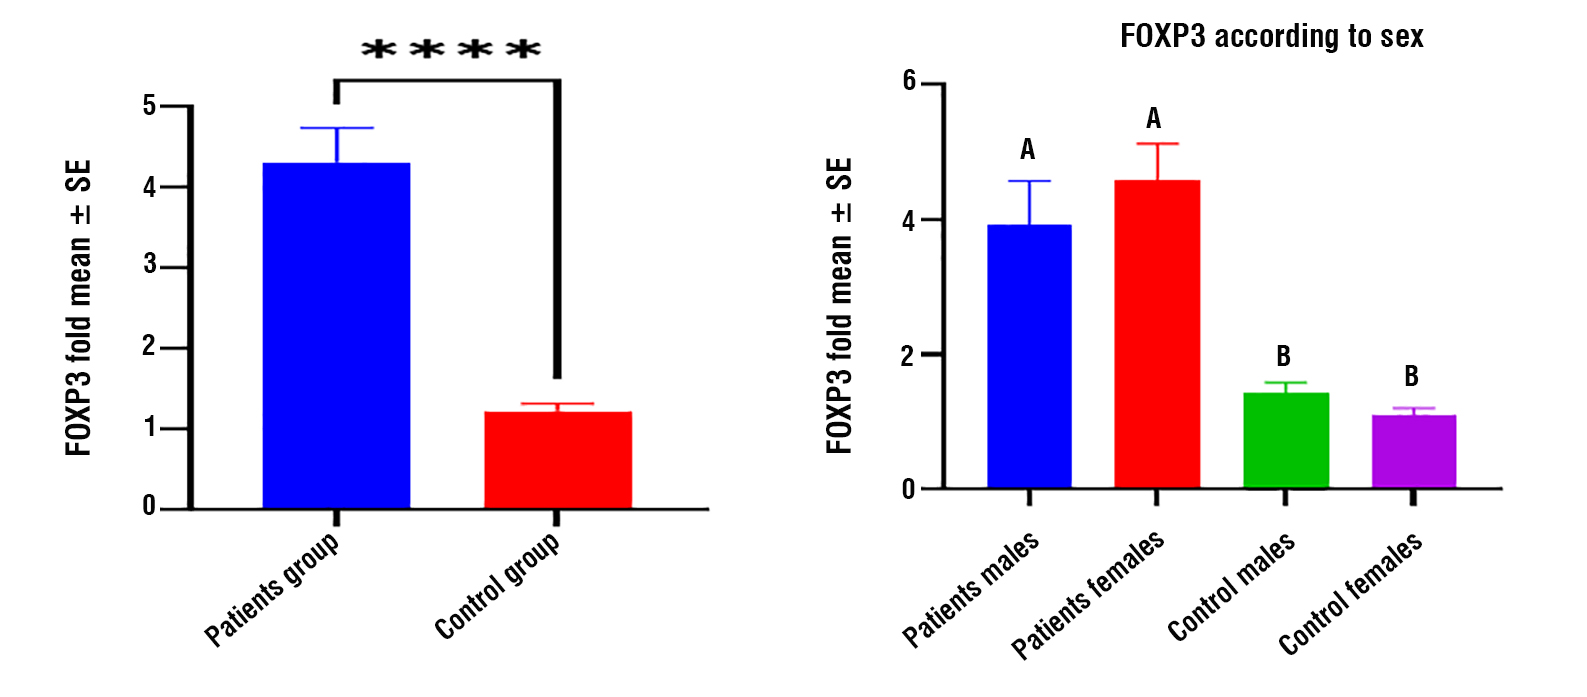
Figure 2a shows the MIR31-5-fold levels in patients compared with the control group. The results indicated that the mean MIR31-5 level in the patient group was 0.73 ± 0.18, while it was 1.16 ± 0.09 in the control group. The results show that the MIR31-5 level was lower in patients compared to healthy individuals, and this difference was statistically significant, as the p-value was < 0.05.
Figure 2b shows the MIR31-5-fold increase by sex in the patient and control groups. The results indicated that the mean MIR31-5 level in the patient group was 0.60 ± 0.11 for males and 0.81 ± 0.30 for females.
Figure 2 - MIR31-5-fold: (a) comparison between CD patients and the control group; (b) comparison between patients and controls according to sex.
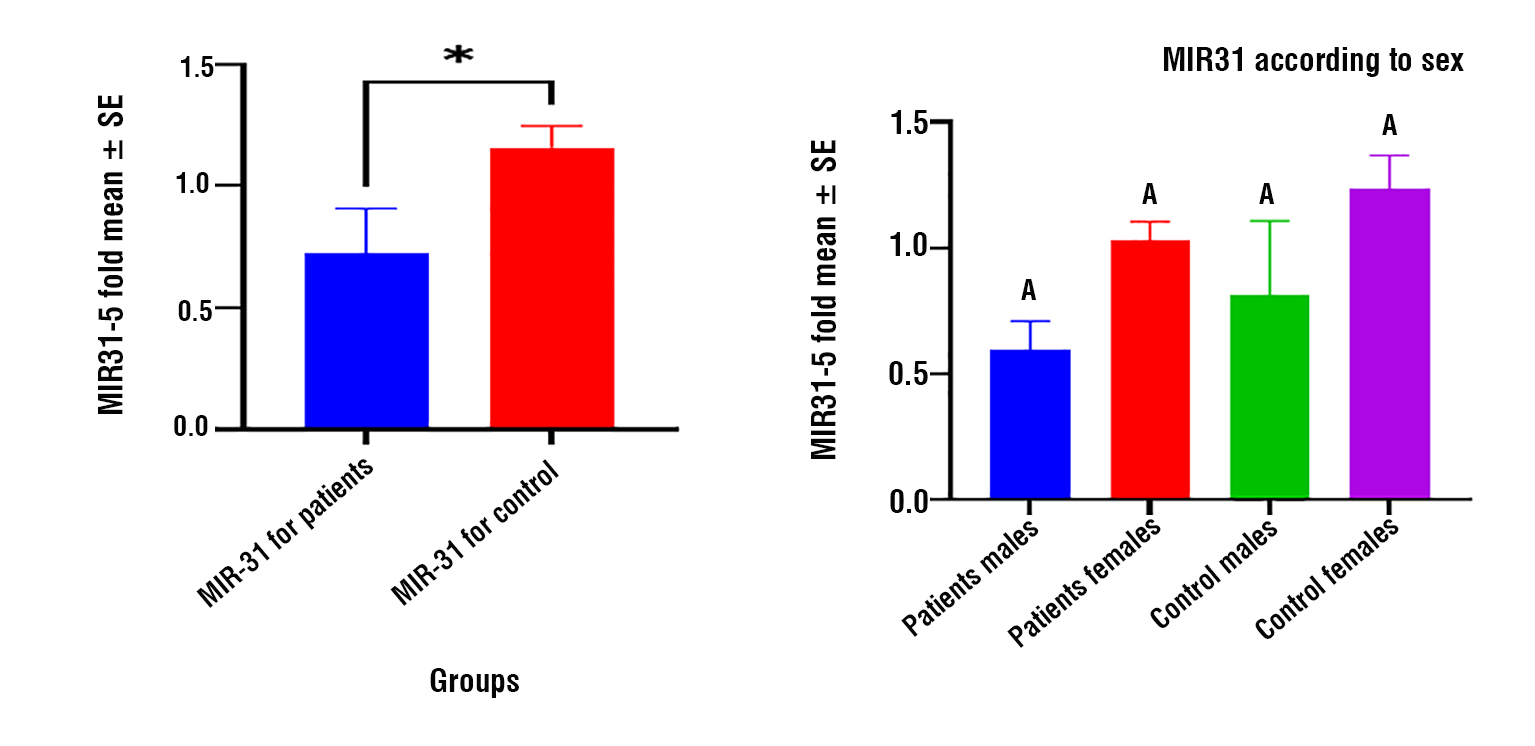
The difference between sexes was not statistically significant, as the p-value was > 0.05. In the control group, the mean MIR31-5 level was 1.03 ± 0.07 for males and 1.23 ± 0.14 for females, with no statistically significant difference between the sexes (p-value > 0.05). Furthermore, the comparison between patients and healthy individuals for each sex showed no statistically significant differences, as all p-values were > 0.05.
Figure 3a shows the levels of tTg IgA in patients with CD compared to those in the control group. The results indicated that the mean tTg IgA level in the patient group was 230.09 ± 12.29, compared 5.04 ± 0.92 in control group. The results showed a clear increase in the tTg IgA level in CD patients compared to that in the control, and this difference was highly statistically significant, with a p-value < 0.001. Figure 3b shows the levels of tTg IgA according to sex (female and male) in the CD patients and control groups. In the patient group, the mean tTg IgA level was 223.21 ± 20.47 for males and 234.68 ± 15.48 for females. The difference between patients and healthy individuals within each sex was statistically significant (p < 0.001). In the control group, the mean tTg IgA level was 8.06 ± 2.21 for males and 3.28 ± 0.55 for females, with a statistically significant difference between the patients and healthy individuals (p < 0.001). However, the comparison between males and females within each group showed no statistically significant difference (p > 0.05).
Figure 3 - Levels of tTg IgA : (a) comparison between CD patients and control group; (b) comparison between patients and controls according to sex.
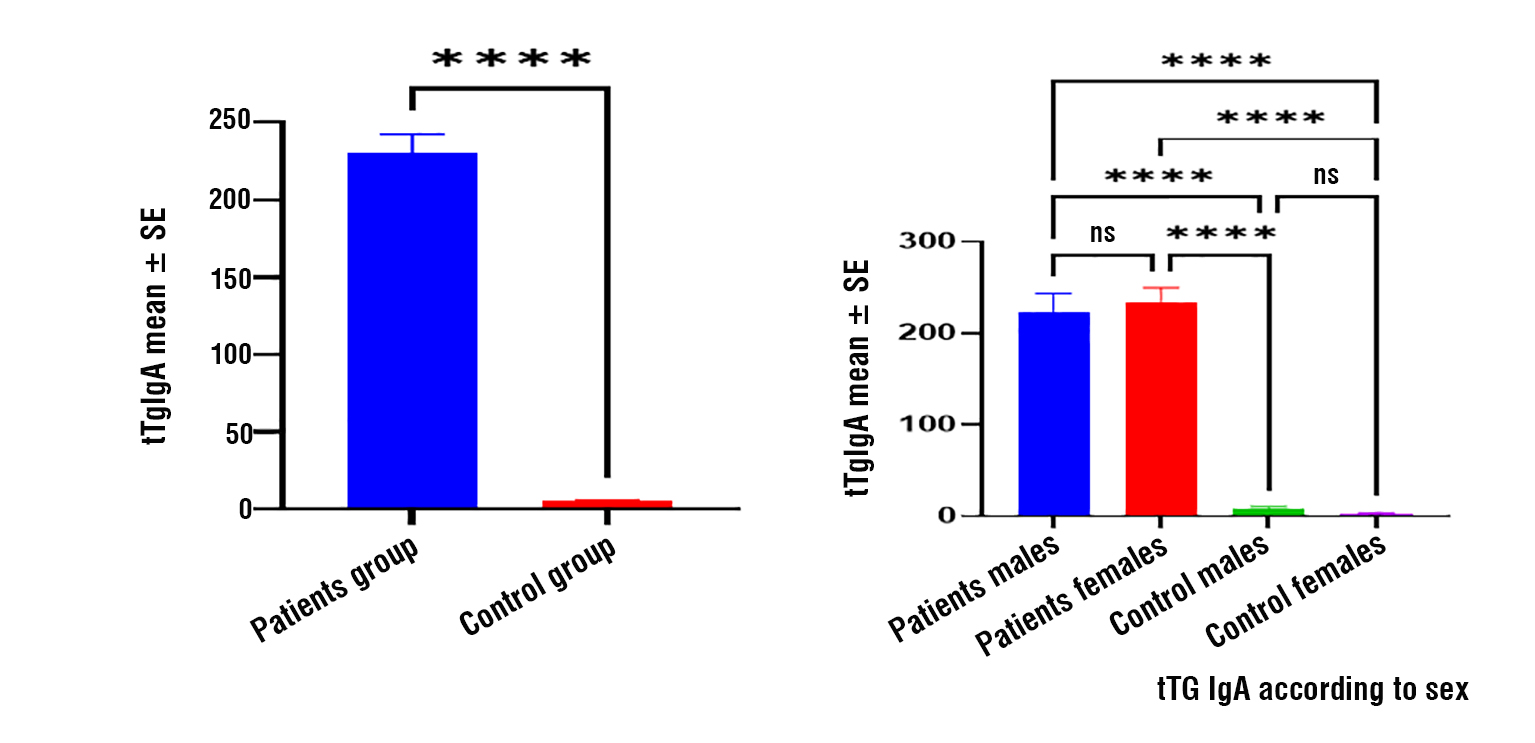
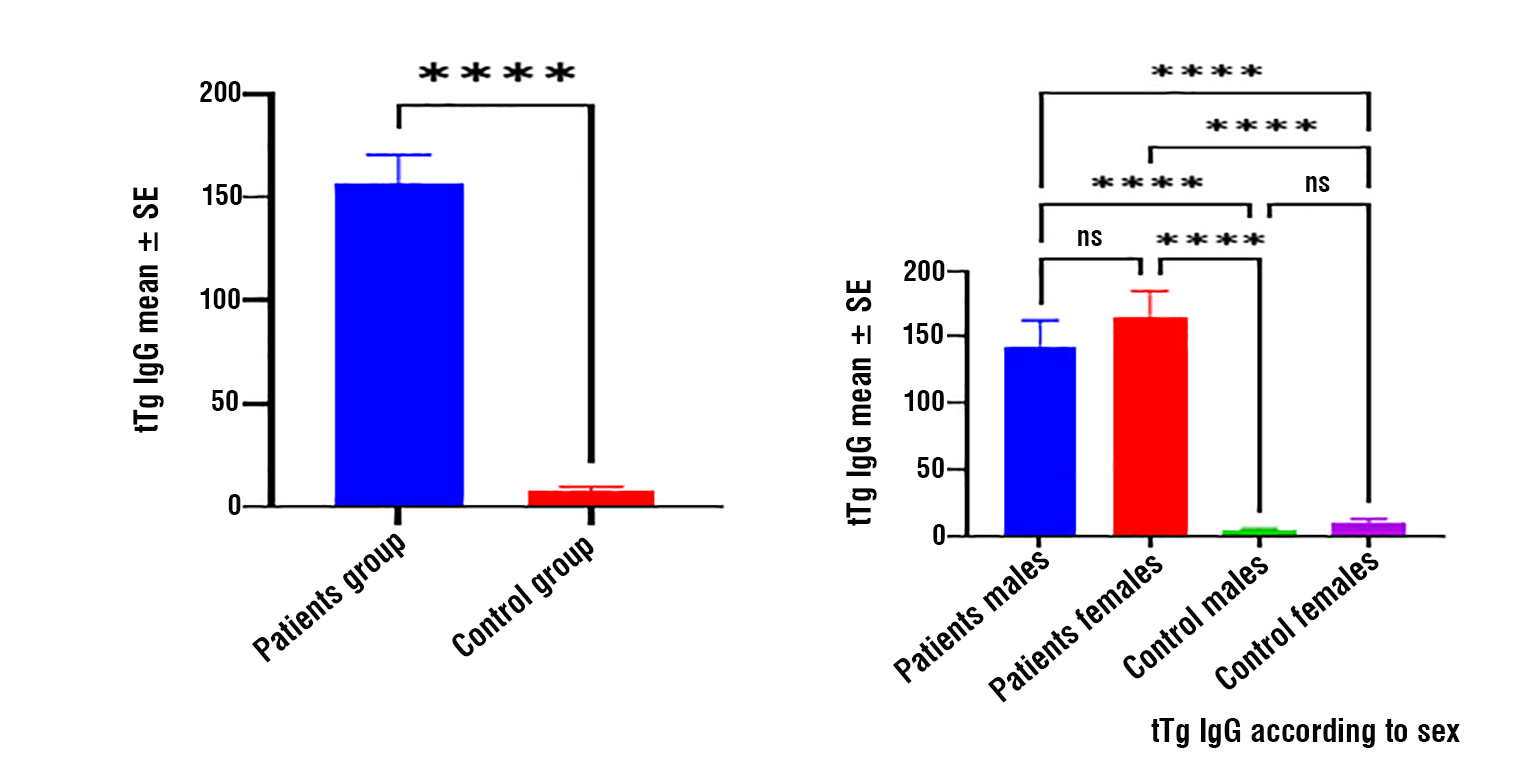
Figure 4a shows tTg IgG levels in CD patients compared to those in the control group. The mean tTg IgG level in the patient group was 156.15 ± 14.41, while in the control group it was 7.76 ± 2.07. The results showed a significant increase in the tTg IgG level in patients compared to healthy individuals, and this difference was highly significant (p < 0.001). Figure 4b shows the tTg IgG levels by sex in the patient and control groups. In the patient group, the mean tTg IgG level was 143.34 ± 19.68 for males and 164.69 ± 20.22 for females. The difference between patients and controls for each sex was statistically significant (p < 0.001). In the control group, mean tTg IgG level was 4.86 ± 1.05 for males and 9.44 ± 3.20 for females, with a statistically significant difference between patients and control (p < 0.001). The comparison between males and females within each group showed no statistically significant differences (p > 0.05).
Figure 4 - tTg IgG levels: (a) comparison between CD patients and control group; (b) comparison between patients and controls according to sex.
Correlation of Immunological and Molecular Markers
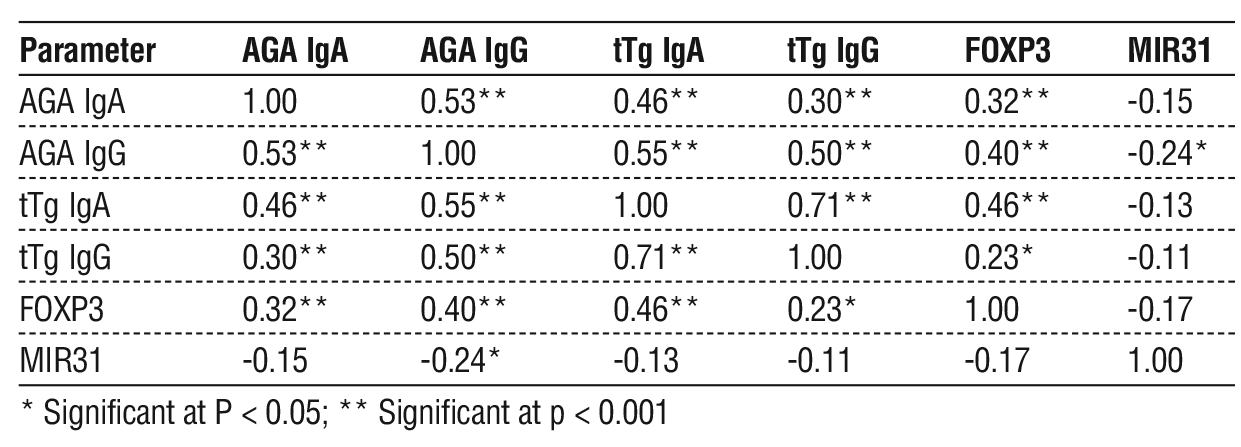
The correlation analysis results in table 2 showed significant relationships between several of the studied immunological and molecular markers in patients with celiac disease. A significant positive correlation was found between AGA-IgA and AGA-IgG as well as with tTG-IgA, tTG-IgG, and FOXP3, indicating that an increased immune response to gluten is associated with elevated antibody levels and activation of regulatory T cells. tTG-IgA levels also showed a strong positive correlation with tTG-IgG levels, reflecting the immunological interrelationship between antibodies associated with celiac disease. In contrast, negative correlations were observed between BMI and immunological markers, particularly tTG-IgA levels. MIR-31-5p showed a negative correlation only with AGA-IgG, while no significant correlations were found with the other markers, which may indicate a limited or indirect regulatory role in the disease mechanism.
Table 2 - Correlations of Age, BMI, AGA IgA, AGA IgG, tTg IgA, tTg IgG, FOXP3, and MIR31 in celiac disease patient.
Discussion
The pathogenesis of celiac disease is complex and involves interplay between genetic, environmental, and immune factors. Celiac disease can affect individuals of any age, although the exact triggers remain unclear. miRNAs play an important role in post-transcriptional gene regulation and contribute significantly to immune regulation and disease development (13). The aim of the present study was to evaluate the regulatory role of miRNA-31-5P in FOXP3 gene expression in Iraqi patients with celiac disease and to investigate its association with immune regulatory mechanisms involved in disease pathogenesis. Assessment of FOXP3 gene expression may provide insights into regulatory T-cell subsets and immune homeostasis in celiac disease (14,15).
The findings of the present study can be interpreted in light of the functional characteristics of FOXP3-expressing regulatory T cells (Tregs), which represent a key CD4 + T cell population involved in immune suppression. Although FOXP3 is a critical transcription factor associated with Treg suppressive function, the absence of significant differences between patients and controls suggests that FOXP3 expression alone may not fully reflect the functional capacity of regulatory T cells. This supports previous evidence indicating that FOXP3⁺ Tregs in celiac disease may be present, but functionally impaired, particularly in their ability to suppress gluten-driven immune responses (16). Such dysfunction, rather than changes in gene expression levels, may contribute more significantly to disease pathogenesis. Furthermore, the lack of sex-related differences in FOXP3 expression suggests that immune dysregulation in celiac disease is mainly driven by disease-specific mechanisms rather than by gender-related immune variations (16,17). The significant downregulation of miR-31-5P in patients indicated a potential loss of regulatory control in immune pathways. Importantly, emerging evidence suggests that FOXP3 expression and stability in regulatory T cells are tightly regulated by miRNA networks, where miRNAs can modulate Treg differentiation, FOXP3 transcriptional activity, and downstream suppressive signaling pathways. Therefore, dysregulation of specific miRNAs may indirectly impair FOXP3-mediated immune tolerance rather than directly altering FOXP3 gene expression. miR-31-5P has been implicated in inflammatory regulation and its downregulation may contribute to enhanced immune activation in celiac disease. In addition, miRNA-mediated disruption of FOXP3-associated signaling pathways may occur through modulation of upstream regulators, such as transcription factors and cytokine signaling cascades (e.g., IL-2/STAT5 pathway), which are essential for Treg stability and function. The absence of sex differences in miR-31-5P expression further suggests that its dysregulation is primarily driven by disease rather than by hormonal or sex-related immune variability. This is consistent with previous evidence that miRNA alterations in autoimmune diseases reflect intrinsic immune dysregulation rather than demographic factors (18).
The present study also demonstrated significant elevations in tTG and EMA autoantibodies in patients with CD compared with controls, particularly tTG IgA (p < 0.001). These findings are consistent with those of previous studies reporting the high diagnostic sensitivity and specificity of anti-tTG antibodies in celiac disease (19-21). Elevated antibody levels have also been associated with the degree of intestinal villous atrophy, supporting their role in disease severity assessment (22). However, some studies have reported even higher diagnostic accuracy for serological markers, which may reflect differences in population characteristics, assay methods, or disease stages (23,24). The observed antibody responses were similar in both males and females, suggesting that humoral immune activation in celiac disease is not strongly influenced by sex once the disease is established (25, 26). Genetic predisposition also plays a major role in disease development, particularly HLA-DQ2 and HLA-DQ8 haplotypes, which increase susceptibility to gluten-related immune activation (27). Anti-tTG IgG also demonstrated diagnostic relevance, particularly in cases of IgA deficiency, consistent with previous studies showing its usefulness as a complementary serological marker (28,29). Anti-EMA antibodies are also elevated in patients, supporting their high diagnostic specificity, as reported in previous studies (30-33). Regarding sex-related differences in autoimmune patterns, some studies have reported a higher prevalence in females, while others suggest minimal differences between sexes in disease presentation and autoimmune profiles (34-36). These inconsistencies may reflect genetic, environmental, and immunological heterogeneity across populations (37-39).
Conclusion
This study suggests that dysregulation of miRNA-31-5P may be associated with altered immune regulatory pathways in Iraqi patients with celiac disease, potentially involving FOXP3-related mechanisms. Although no significant differences were observed in FOXP3 gene expression between patients and controls, its role may be related to functional activity within mucosal immune regulation rather than changes in expression levels alone. The observed reduction in miRNA-31-5P, together with elevated tissue transglutaminase (tTG) autoantibodies, may indicate that immune dysregulation in celiac disease involves miRNA-associated regulatory mechanisms. However, these findings should be interpreted with caution as they reflect associative rather than causal relationships. Overall, these results highlight the potential importance of evaluating regulatory miRNAs alongside FOXP3 in understanding immune responses in celiac disease, although further large-scale studies are required to confirm their diagnostic and mechanistic relevance.
Conflicts of Interest
The authors declare no conflict of interest regarding this article.
Funding: None.
References
1. Comani G, Panceri R, Dinelli M, Biondi A, Mancuso C, Meneveri R, et al. miRNA-regulated gene expression differs in celiac disease patients according to the age of presentation. Genes Nutr. 2015;10(5):32.
2. Al-Masudi AA, Al-Thwani AN. Grinding Halt Celiac Disease by Gluten Free Diet. Iraqi J Biotechnol. 2022;21(2):568-73.
3. Gatti S, Rubio-Tapia A, Makharia G, Catassi C. Patient and community health global burden in a world with more celiac disease. Gastroenterology. 2024;167(1):23-33.
4. Abass EA. Relationship Between Interleukin-33 (IL-33) and C-Reactive Protein in Iraqi Women Patients with Celiac Disease. Ibn AL-Haitham J Pure Appl Sci. 2017;27(1):288-96.
5. Hasan HR, Kadhum ZIA, Ghadhban JM. Biochemical Markers of Iron Status Among Iraqi Patients at Different Severity Levels of Celiac Disease. Iraqi J Sci. 2024;65(1):593-605.
6. Besser HA, Khosla C. Celiac disease: mechanisms and emerging therapeutics. Trends Pharmacol Sci. 2023;44(12):949-62.
7. Cataldo F, Lio D, Marino V, Picarelli A, Ventura A, Corazza G. IgG1 antiendomysium and IgG antitissue transglutaminase (anti-tTG) antibodies in coeliac patients with selective IgA deficiency. Gut. 2000;47(3):366-9.
8. Ding M, Brengdahl J, Lindqvist M, Gehrmann U, Ericson E, von Berg S, et al. A phenotypic screening approach using human treg cells identified regulators of forkhead Box p3 expression. ACS Chem Biol. 2019;14(3):543-53.
9. Ono M. Control of regulatory T-cell differentiation and function by T-cell receptor signalling and Foxp3 transcription factor complexes. Immunology. 2020;160(1):24-37.
10. Kolkova Z, Suroviakova S, Grendar M, Havlicekova Z, Hornakova A, Holubekova V, et al. Altered miRNA expression in duodenal tissue of celiac patients and the impact of a gluten-free diet: a preliminary study. Mol Biol Rep. 2025;52(1):1-12.
11. Jha D, Singh N, Makharia G. Celiac Disease: Conventional and Novel Biomarkers. Gastroenterol Clin North Am. 2025;54(1):(In Press).
12. Okab HF, Khazaal H, Majed MM. Estimation of Immunological and Physiological Parameters in Diabetic Patients with COVID-19. Rev Bionatura. 2023;8(2):8-11.
13. Amr K, Bayoumi F, Eissa E, Abu-Zekry M. Circulating microRNAs as potential non-invasive biomarkers in pediatric patients with celiac disease. World J Clin Cases. 2019;7(13):1598-1608.
14. Tan IL, Barisani D, Panceri R, Modderman R, Visschedijk M, Weersma RK, et al. A combined mRNA-and miRNA-sequencing approach reveals miRNAs as potential regulators of the small intestinal transcriptome in celiac disease. Int J Mol Sci. 2021;22(21): 11382.
15. Felli C, Baldassarre A, Uva P, Alisi A, Cangelosi D, Ancinelli M, et al. Circulating microRNAs as novel non-invasive biomarkers of paediatric celiac disease and adherence to gluten-free diet. EBioMedicine. 2022;76:103855.
16. Yilmaz F, Atay K. FOXP3 expression in duodenal mucosa: Unique role in pathogenesis and differential diagnosis of celiac disease. Ann Diagn Pathol. 2025;74:152393.
17. Asri N, Mojarad EN, Taleghani MY, Houri H, Niasar MS, Rezaei-Tavirani M, et al. Evaluating CD4 and Foxp3 mRNA expression in tissue specimens of celiac disease and colorectal cancer patients. Asian Pac J Cancer Prev. 2024;25(2):647-53.
18. Giuffrida P, Di Sabatino A. MicroRNAs in celiac disease diagnosis: a miR curiosity or game-changer? Dig Dis Sci. 2020;65(7):1877-9.
19. Lebwohl B, Sanders DS, Green PH. Coeliac disease. Lancet. 2018;391(10115):70-81.
20. Cerqueiro Bybrant M, Udén E, Frederiksen F, Gustafsson AL, Arvidsson CG, Fureman AL, et al. Celiac disease can be predicted by high levels of tissue transglutaminase antibodies in children and adolescents with type 1 diabetes. Pediatr Diabetes. 2021;22(3):417-24.
21. Ibaid I, Hussien M, Kaukinen K, Sabir O, Elmekki M, Musa A, et al. Role of HLA-DQ typing and antitissue transglutaminase antibody titres in diagnosing coeliac disease among Sudanese children with type 1 diabetes mellitus. BMJ Open Gastroenterol. 2022;9(1): e000844.
22. Jabour HJ, Rahman SAHA. The prevalence of Celiac Disease in Iraqi children and adolescents with type 1 Diabetes Mellitus. J Pharm Sci Res. 2018;10(9):2289-91.
23. Oliveira DR, Rebelo JF, Maximiano C, Gomes MM, Martins V, Meireles C, et al. HLA DQ2/DQ8 haplotypes and anti-transglutaminase antibodies as celiac disease markers in a pediatric population with type 1 diabetes mellitus. Arch Endocrinol Metab. 2022;66(2): 229-36.
24. Shatnawei A, AlNababteh AH, Govender RD, Al-Shamsi S, AlJarrah A, Al-Rifai RH. Mode of presentation and performance of serology assays for diagnosing celiac disease: A single-center study in the United Arab Emirates. Front Nutr. 2023;10:1107017.
25. Verma AK, Gatti S, Lionetti E, Galeazzi T, Monachesi C, Franceschini E, et al. Comparison of Diagnostic Performance of the IgA Anti-tTG Test vs IgA Anti–Native Gliadin Antibodies Test in Detection of Celiac Disease in the General Population. Clin Gastroenterol Hepatol. 2018;16(12):1997-8.
26. Ciacci C, Bai JC, Holmes G, Al-Toma A, Biagi F, Carroccio A, et al. Serum anti-tissue transglutaminase IgA and prediction of duodenal villous atrophy in adults with suspected coeliac disease without IgA deficiency (Bi. A. CeD): a multicentre, prospective cohort study. Lancet Gastroenterol Hepatol. 2023;8(11):1005-14.
27. Dahlbom I, Olsson M, Forooz NK, Sjöholm AG, Truedsson L, Hansson T. Immunoglobulin G (IgG) anti-tissue transglutaminase antibodies used as markers for IgA-deficient celiac disease patients. Clin Vaccine Immunol. 2005;12(2):254-8.
28. Thammarakcharoen T, Hirankarn N, Sahakitrungruang T, Thongmee T, Kuptawintu P, Kanoonthong S, et al. Frequency of HLA-DQB1* 0201/02 and DQB1* 0302 alleles and tissue transglutaminase antibody seropositivity in children with type 1 diabetes mellitus. Asian Pac J Allergy Immunol. 2017;35(2):82-5.
29. AL-Hilali HA, Mohammad BI, Khlebos AH. The Relationship Between The Type 1 Diabetes And Celiac Disease: A Study Based On Anti Tissue Transglutaminase Antibodies And Anti-Glidine Antibodies Screening. Al-Qadisiyah Med J. 2015;11(20):197-204.
30. Lewandowska K, Ciepiela O, Szypowska A, Wyhowski J, Głodkowska-Mrówka E, Popko K, et al. Celiac antibodies in children with type 1 diabetes–a diagnostic validation study. Autoimmunity. 2018;51(2):81-8.
31. Abdulrahim A, Fagih M, Troncone R, Bashir MS, Asery A, Alruwaithi M, et al. Deamidated Gliadin Antibodies: Do They Add to Tissue Transglutaminase-IgA Assay in Screening for Celiac Disease? J Pediatr Gastroenterol Nutr. 2021;72(5):e112-e8.
32. Gould MJ, Brill H, Marcon MA, Munn NJ, Walsh CM. In screening for celiac disease, deamidated gliadin rarely predicts disease when tissue transglutaminase is normal. J Pediatr Gastroenterol Nutr. 2019;68(1):20-5.
33. Anbardar MH, Haghighi FG, Honar N, Zahmatkeshan M. Diagnostic value of immunoglobulin G anti-deamidated gliadin peptide antibody for diagnosis of pediatric celiac disease: a study from Shiraz, Iran. Pediatr Gastroenterol Hepatol Nutr. 2022;25(4):312-22.
34. Akirov A, Pinhas-Hamiel O. Co-occurrence of type 1 diabetes mellitus and celiac disease. World J Diabetes. 2015;6(5):707-14.
35. Jansson-Knodell CL, King KS, Larson JJ, Van Dyke CT, Murray JA, Rubio-Tapia A. Gender-based differences in a population-based cohort with celiac disease: more alike than unalike. Dig Dis Sci. 2018;63(1):184-92.
36. Gannon M, Kulkarni RN, Hubert MT, Mauvais-Jarvis F. Sex differences underlying pancreatic islet biology and its dysfunction. Mol Metab. 2018;15:82-91.
37. Wilkinson NM, Chen H-C, Lechner MG, Su MA. Sex differences in immunity. Annu Rev Immunol. 2022;40(1):75-94.
38. Lima RF, da Silva Kotze LM, Kotze LR, Chrisostomo KR, Nisihara R. Gender-related differences in celiac patients at diagnosis. Arch Med Res. 2019;50(7):437-41.
39. Rossi RE, Masoni B, De Deo D, Ferraris M, Franchellucci G, Hassan C, et al. Gender-related differences in celiac disease presentation and follow-up in adult patients. Expert Rev Gastroenterol Hepatol. 2025;19(8):871-6.
Full Text Sources:

Abstract:

Views: 43


For Authors
Journal Subscriptions

Jun 2026
Supplements
Instructions for authors
Online submission
Contact
e-ISSN: 2601 - 1700 (online)
ISSN-L: 2559 - 723X
Journal Abbreviation: Surg. Gastroenterol. Oncol.
Surgery, Gastroenterology and Oncology (SGO) is indexed in:
- SCOPUS
- EBSCO
- DOI/Crossref
- Google Scholar
- SCImago
- Harvard Library
- Open Academic Journals Index (OAJI)
Surgery, Gastroenterology and Oncology (SGO) is an open-access, peer-reviewed online journal published by Celsius Publishing House. The journal allows readers to read, download, copy, distribute, print, search, or link to the full text of its articles.
Time to first editorial decision: 25 days
Rejection rate: 61%
CiteScore: 0.2
 IASGO Society News

Meetings and Courses in 2025
Meetings and Courses in 2024
Meetings and Courses in 2023
Meetings and Courses in 2022
Meetings and Courses in 2021
Meetings and Courses in 2020
Meetings and Courses in 2019
Verona expert meeting 2019

Surgery, Gastroenterology and Oncology applies the Creative Commons Attribution Non Commercial (CC BY-NC 4.0) license, which permits readers to copy and redistribute the material in any medium or format, remix, adapt, build upon the published works non-commercially, and license the derivative works on different terms, provided the original material is properly cited and the use is non-commercial. Please see: https://creativecommons.org/licenses/by-nc/4.0/
Publisher’s Note:
The opinions, statements, and data contained in article are solely those of the authors and not of Surgery, Gastroenterology and Oncology journal or the editors. Publisher and the editors disclaim responsibility for any damage resulting from any ideas, instructions, methods, or products referred to in the content.