Surgery, Gastroenterology and Oncology

|
|
Introduction: Acute myeloid leukemia (AML) is a cancer that affects the myeloid line of blood cells. It is the most prevalent type of acute leukemia in adults. This study aimed to provide insights into Iraqi patients diagnosed with Acute Myeloid Leukemia (AML).
Methods: A total of 90 samples were included in the study,60 samples were from patients with AML and 30 were from healthy controls, both males and females, with ages ranging from (16-73 years). Peripheral blood samples were collected from all patients and healthy controls groups, patients of AML. from (March 2023 to December 2023). Serum levels of IL-6, IL-10, and TNF-? were estimated using an ELISA kit, and hematological parameters, such as RBC count, HB, HCT, platelets, and WBC count, were measured using (CBC) apparatus (HUMA COUNT30/Germany). The difference in MDR1 gene expression between patients with acute myeloid leukemia and healthy individuals was investigated.
MDR1 expression was measured after extraction of total RNA at various concentrations, and gene expression was used to calculate the double ?Ct value to assess MDR1 expression in the presence of GAPDH as a reference gene.
Results: IL-6, IL-10, and TNF-? levels were significantly higher in newly diagnosed and relapsed patients with AML than those in the control group, and their levels decreased in patientswith AML responded to the chemotherapy. However, the results showed a significant decrease in RBC count, percentage of Hb and HCT and Platelets in newly diagnosed patients compared with the treated and healthy control groups, while a significant increase in WBC count of newly diagnosed and treated leukemia was comparable to that of the healthy control group. Based on statistical analysis of gene expression folding (2-??Ct) indicated that there was a significant decrease in the gene expression of MDR1 in Leukemia patients treated (0.6447) compared to the results of the gene expression in the MDR1 in other two groups, leukemia patients (without treatment) and the healthy control group (1.1401) (1.3585, respectively).
Conclusion: Immunological parameters, CBC, and significant differences in MDR1 gene expression are important indicators of the severity and treatment response of patients with AML.
Introduction
Acute myeloid leukemia (AML) is a form of leukemia that is characterized by multiple types of irregular myeloid cells known as myeloid cells, which can be identified through clinical, cytogenetic, and molecular analysis (1). It is the most lethal form of leukemia (2). Manifest the buildup of hematopoietic cells in lymph or blood circulation (3). A rapid increase in abnormal white blood cells in the bone marrow impairs the production of normal white blood cells (4). This is a clearly defined subset of the diseases. It comprises a significant proportion of adults (5). The median age of the patients was 67 years (5). Regrettably, the underlying cause of AML remains predominantly unidentified (6). Several risk factors have been implicated, including exposure to radiotherapy, chemotherapy, benzene, and radiation (7).
Furthermore, numerous studies have suggested that genetic modification is linked to increased susceptibility to AML (7). The interaction between inflammation and the tumor microenvironment (TME) is a key factor that contributes to the growth of cancer cells. The tumour microenvironment (TME) is an intricate network that encompasses tumor and immune cells, cytokines, enzymes, and various other components (8). Cytokines, which are crucial mediators of immune responses, facilitate the coordination of cellular activities with immune responses. Cytokines also play a role in externalizing the cellular defense (9). In patients with acute myeloid leukemia (AML), Cytokines are released by leukemic blasts and immune cells in patients with acute myeloid leukemia. However, the exact role of these cytokines in the development of acute leukemia is not fully understood (10).
Multiple studies have confirmed a correlation between acute myeloid leukemia (AML) severity and the presence of interleukin 6 (IL 6) (11). Tumor necrosis factor-alpha (TNF A) and chronic inflammation are closely linked to the tumor environment. Interleukin 6 (IL 6) is a cytokine that has various inflammatory effects and different effects on the growth of leukemic blasts (12). Interleukin 6 levels in the bloodstream can serve as prognostic indicators in addition to the follow-up criteria for early identification of relapse in individuals diagnosed with acute myeloid leukemia (13).
TNF-?, an inflammatory cytokine, is predominantly synthesized by macrophages. It has the capacity to stimulate cell differentiation and proliferation as well as induce cell death and regeneration. Consequently, TNF-? has been associated with various diseases, including cancer. This cytokine plays a role in cancer progression, as it is involved in all cellular processes, including survival, proliferation, transformation, angiogenesis, invasion, and metastasis (14,15).
However, IL 10 is the primary anti-inflammatory cytokine involved in the human immune response. It acts as a suppressor of Th1 cytokines, such as IL 2 and IFN g, andr of the production of pro-inflammatory y cytokines in monocytes/macrophages s. IL 10 has been found to be present ine leukemic cells in f the majority of ALL and AML cases. It inhibits t immune responses, indicating that IL 10 may be linked to the ability of leukemia cells to evade immune surveillance (16).
MDR1, also known as P glycoprotein (P gp), is a protein that belongs to the ATP binding cassette subfamily. It is necessary for the ATP-dependent removal of a wide variety of substances from cells (17). This transporter plays an essential role in drug disposition, including drug absorption, distribution, and excretion. Additionally, it may be involved in steroid regulation (18). MDR1, a human gene, is located on chromosome 7q21.12 and consists of 29 exons, which vary in size from 49 to 587 base pairs. The genomic region that encompasses the MDR1 gene spans 209.6 kilobases (19). The cDNA comprised 3843 nucleotide base pairs (20).
MDR1 is expressed in organs involved in xenobiotic metabolism and excretion (the gastrointestinal system, kidney, and liver). Therefore, MDR1 plays a crucial role in eliminating carcinogenic substances (21). MDR1 exhibited a high degree of genetic variation. Approximately 1000 single nucleotide polymorphisms (SNPs) have been identified (22,23). The SNP C1236T in exon 12 has the same meaning as another SNP, and different genetic studies have focused on the C3435T variant in exon 26. This genetic variation impacts the expression, function, and activity of MDR1 transcription through different processes (24). Several genetic epidemiological studies have reported a positive association between this polymorphism in MDR1 and cancer risk, such as acute lymphoblastic leukemia, breast cancer, acute myeloid leukemia, and non-Hodgkin lymphoma (25,26).
M1/P gp is present in various tissues throughout the human body, including the liver, pancreatic ducts, intestine, kidney, adrenal cortex, placenta, endothelium of brain capillaries, and the choroid plexus epithelium (27). In addition, certain blood cell populations exhibit substantial levels of MDR1. Approximately 50 percent of patients with AML or acute myeloid leukemia have leukemic blasts that express MDR1 or ABCB1, with a slightly higher occurrence and intensity in older individuals (28). The MDR1 or ABCB1 gene product is more common in older patients and has been more closely associated with unfavorable outcomes in this specific population group. The significance of MDR1 or ABCB1 expression as prognostic factors may vary depending on the patient’s age. This could be due to the fact that younger patients tend to receive more aggressive chemotherapy treatments compared to older patients. This bias could potentially overshadow the importance of MDR1 or ABCB1 expression as prognostic factors in younger patients (29).
Methods
Patients and Control
A total of 90 samples were included in the study; 60 samples were from patients with AML, and 30 were from healthy controls, both males and females, with ages ranging from (16 73 years). Healthy controls were recruited in the same age group as the patients, so there were no significant differences in age. Peripheral blood samples were collected from all patients and healthy control groups, patients of AML, were provided by Nassyhria Teaching Hospital in Thi Qar City, Iraq, during the period from (March 2023 to December 2023).
The sera of patients and controls were assessed for the levels of three cytokines, which were IL 6, IL 10, TNF ?, using ELISA based on similar principles according to the Elabscience company. Hematological para-meters such as RBC count, HB, HCT, platelets, and WBC count were measured using (CBC) apparatus (HUMA COUNT30/Germany).
Extraction of RNA and Synthesis of cDNA
The real-time PCR experiment was designed as a singleplex assay, and the chemistry used in real-time qPCR was the DNA binding dye SYBR Green1. The method used for quantification of gene expression in RT qPCR was “two steps” RT qPCR, in this method -RNA was isolated from blood samples, after RNA extraction, cDNA was synthesized by use reverse transcriptase PCR and used as template for real time. The used to investigate the expression of the MDR gene. Total RNA was isolated using a GENEzol TriRNA Pure Kit (Geneaid, UK). The extracted RNA was analyzed using a NanoDrop (Thermo Scientific). RNA was converted into cDNA using TransScript One-Step gDNA Removal and cDNA Synthesis SuperMix (TRAN;China) according to the manufacturer’s instructions. The quantitative real-time PCR system (Stratagene Mx3000; USA) was performed using SYBR Green method (Syber green Master mix Kit; Promega /USA).
Primers Selection
For the estimation of MDR1 expression, two primers were used: one primer designed specifically for the MDR1 gene and another primer designed specifically for the housekeeping gene known as glyceraldehyde -3- phosphate dehydrogenase (GAPDH).
RT-qPCR Reactions and Analysis A total volume of 20 ?l reaction containing 4 ?l of cDNA, 12.5 ?l SYBR Green master mix, 1 ?l of each forward and reverse, and completed the volume with nuclease-free water and was run according to the following program: an initial activation step at 94 °C for 4 min, 40 cycles of denaturation at 94 °C for 30 s, annealing at 60 °C for 30 s, and extension at 72 °C for 20 min. s. qPCR procedure was performed, in duplicates.
Data Analysis
The 2–??Ct method was used to assess the transcription level in the studied samples. The following equations summarize the optimal calculations to determine the folding of the studied samples.
Folding = 2^ ??CT, ??CT = ?CT treated ? ?CT control, ?CT = CT gene ? CT housekeeping gene (31). The threshold cycle (CT) method was employed to calculate relative expression for quantitative RT qPCR.
Ethical Use of Data
Upon explaining the study's objectives to the patients, verbal consent was obtained from them prior to conducting the interviews. Participant names were substituted with identification codes to ensure data confidentiality.
Statistical Analysis
One-way ANOVA and the chi-square test were used to compare means and parametric variables. The results were reported as the mean ± standard deviation, and LSD. Differences were deemed significant if p-values were < 0.05. Statistical analysis was performed using the SPSS 19 Statistics.
Result
Comparison of cytokine’s levels and hematological parameters of acute leukemia groups compare with healthy control group
The data shown in fig. 1 a indicate that there was a significant increase (P?0.05) in the levels of IL6 in patient suffering from leukemia [new diagnosis (without treatment)] and treated patients with (37.60, 28.50 pg/ml) levels as compared to the healthy control group (22.30 pg/ml). Interleukin 10 increase significantly P ? 0.05) in leukemia [new diagnosis (without treatment d)] and treated patientsh (16.63 and 9.60, ) respectivel, s compared e with the control grouph (6.68 pg/ml). In n contrast d, TNF? levels l increased e significantly
P ? 0.05 in all patient groups p (newt untreated d and treated leukemia patients with (165.26, 113.7, 0 and 108.6, respectively 6)y.s. The e results showedt a significant decreas (e P ? 0.0) 5 in f RBC count, percentage of Hb and HCT and Platelets in newly w diagnosed s (without treated) leukemia patients t compared with treated and healthy control group, s as shown in fig. 1 b, c, d, e respectively. As seen a in fig. 1 f exhibited that a significant y increase in WBC count of new diagnosis (without treated) and treated leukemia patients compared to the healthy control group.
Figure 1 - (a) Serum IL6, IL10 and TNF levels; (b) RBC count; (c) Hb concentration; (d) Platelets count; (e) Hematocrit; (f) WBC count.

Gene Expression Analysis of MDR Gene
Based on the statistical analysis of the studied samples, as shown in table 1 a significant decrease in the gene expression of MDR1 in Leukemia patients (treated) was (0.6447) compared to the results of the gene expression in the MDR1 in other two groups. Leukemia patients(treated) and healthy control group where they were (1.1401), (1.3585) respectively, (table 2, fig. 2).
Table 1 - Real time PCR (qPCR) primer sequences used for the transcript analysis (Absarul et al., 2020) (30).
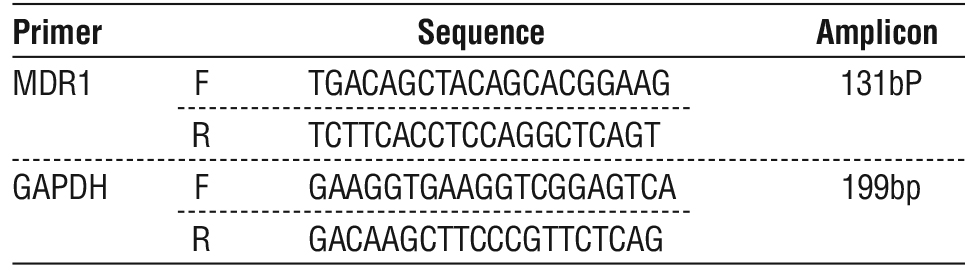
Table 2 - Gene Expression for the MDR1 gene in Leukemia Patients and Healthy Control Group.
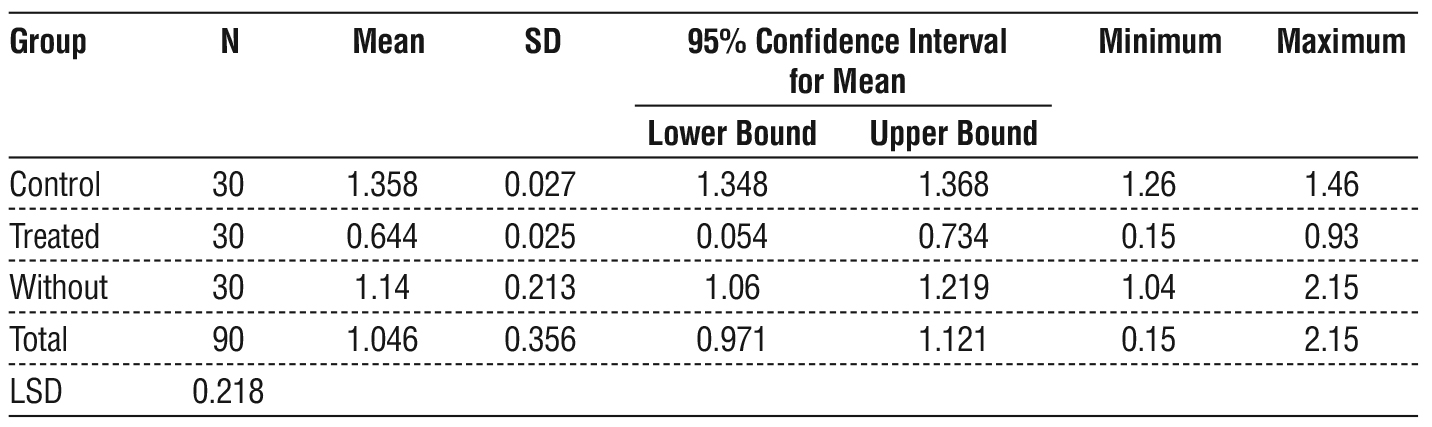
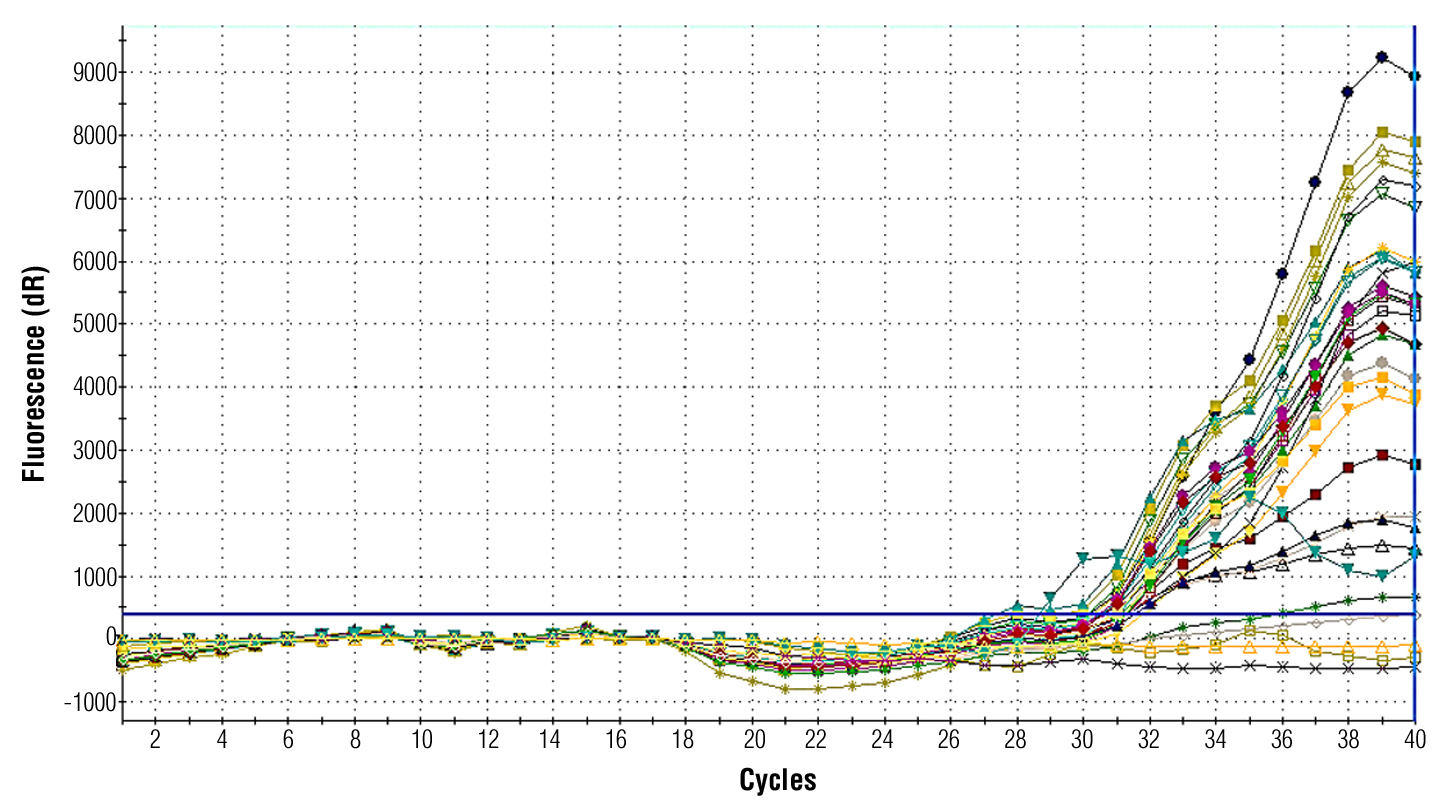
Figure 2 - Real time PCR amplification plot for MDR1 gene that show difference in threshold cycle numbers (Ct value) between patients and control groups.
Distribution of Study Sample of Gene Expression for the MDR1 According Gender
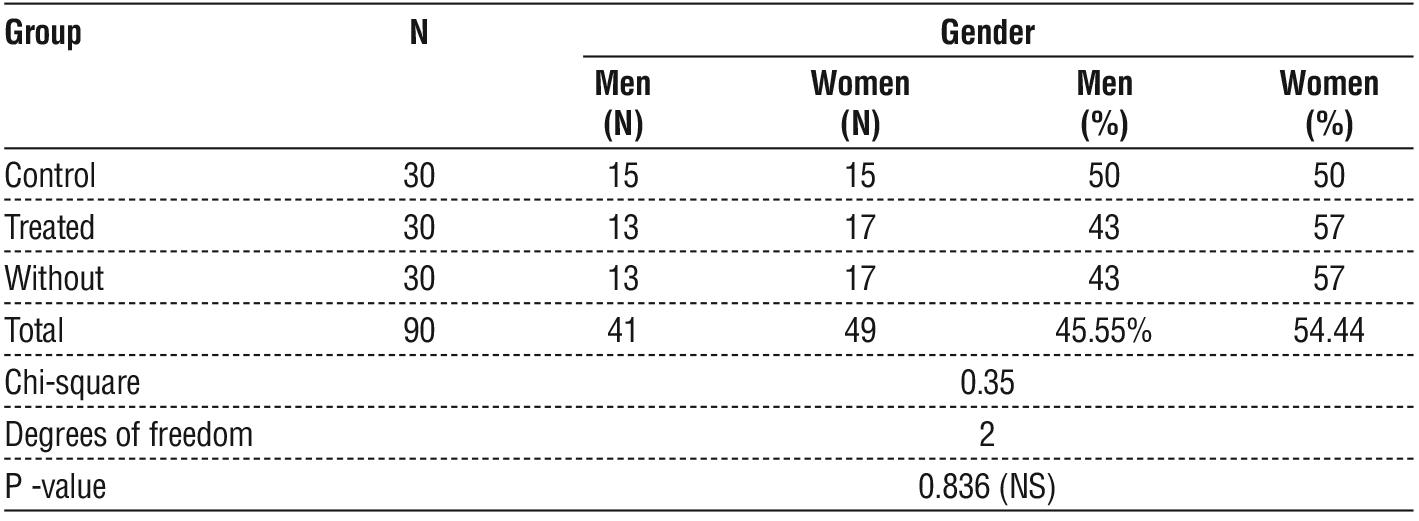
The data illustrated in table 3 revealed no significant differences between the rate of men injured in acute leukemia by a percentage of 43 % and control by a percentage of 50 %, while the incidence in women was 57 % and control by 50 %. There were no significant differences between the healthy control group and patients, whereas the gene Expression for the MDR1 decreased significantly (P ? 0.05) in patients with a new diagnosis of leukemia and leukemia in both men and women.
Table 3 - Distribution of Gene Expression for the MDR1 gene in Acute Leukemia Patients and Healthy Control Group According to Gender.
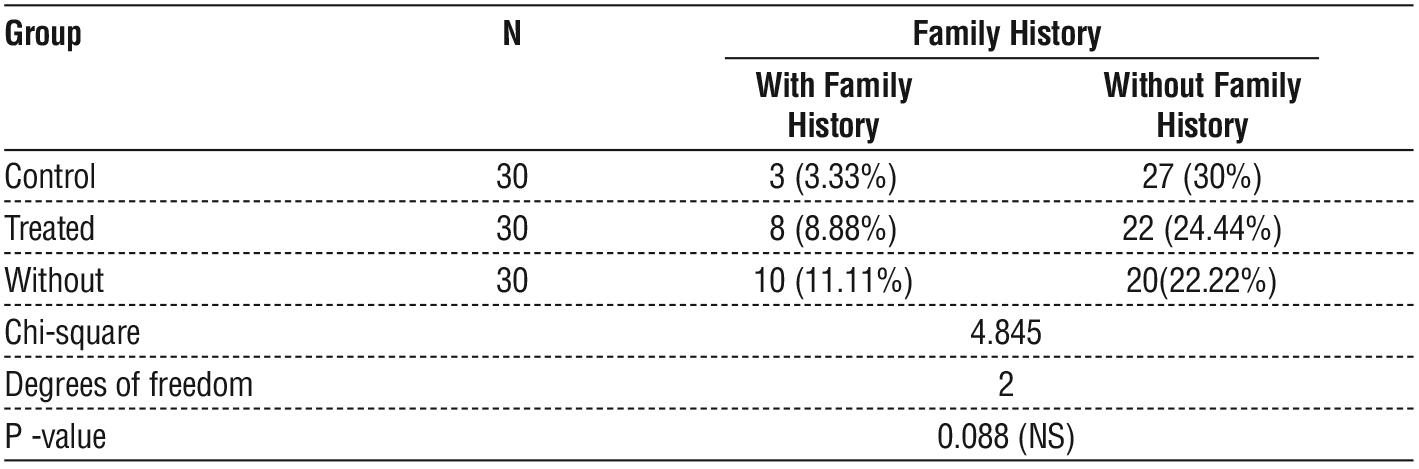
The results presented in table 4 revealed no significant differences in patients who did not have a family history and had a family history of acute leukemia (new diagnosis and treatment) compared with the healthy control group. A significant decrease P ? 0.05 in the gene expression of MDR1 was observed in patients with new diagnoses of leukemia and leukemia compared with the control group in both groups with and without family history.
Table 4 - Distribution of Gene Expression for the MDR1 gene according to family history.
Discussion
The current study showed a highly significant difference between new diagnosis (without treated), treated patients and healthy control for serum IL-6, IL-10 , and, TNF-? levels is shown in fig. 1 with P-value (0. 05) for IL-6, (37.60, 28.50 pg/ml) respectively compared to healthy control group with (22.30 pg/ml), IL-10 (16.63 and 9.60) and control group with (6.68pg/ml).finally, TNF? level increase significantly P?0.05 in all patient group (new without treated and treated leukemia patients with (165.26, 113.70 and 108.66) receptively.
The study conducted by (32) yielded similar findings to our own research, indicating that the expression of cytokines, such as IL 6, IL 8, IL 10, TNF ?, TNF ?, IL 17F, and IL 22, was significantly higher (P < 0.05) at the time of initial AML diagnosis in patients in the remission groups compared to their levels after two chemotherapy sessions.
According to (33), the levels of IL 6 and IL 10 were notably elevated in newly diagnosed AML patients compared with those in the control group. However, these levels decreased when the patients responded to induction chemotherapy, which aligns with our findings. Another study (34) corroborated our findings, showing that the levels of IL 6 in the serum of patients with newly diagnosed and relapsed acute myeloid leukemia (AML) were significantly higher than those in the control group. Additionally, the concentration of IL 6 decreased during remission. They found that the IL 6 serum level in the AML patient group was lower than that in the control group, which contradicts our results. Elevated levels of IL 6 may serve as a useful indicator of the disease and a potential focus for novel treatments in pediatric AML patients. However, (35) contradicted these findings by discovering that the serum concentration of IL 6 in the AML study group was notably lower than that in the control group.
The function of IL 10 in the development of cancer has been discovered to be intricate and multifaceted. However, there is substantial evidence indicating that IL 10 plays a vital role in preventing the immune system, enabling cancerous cells to avoid detection by the immune system, and facilitating the growth and spread of cancer (36). IL 10 has been identified in the leukemic cells of the majority of ALL and AML cases. It inhibits immune responses, indicating that IL 10 may be linked to evasion of leukemia cells from immune surveillance (37).
The levels of TNF ? were notably elevated in the patients in comparison with the control group, suggesting a positive correlation between a pro-inflammatory cytokine and an increased sensitivity to AML. This result coincides with previous research conducted by (38), which validated that having a high level of TNF ? in the blood is a negative predictor for survival and Effective Free Persistence in individuals with high-risk MDS or untreated AML (39). This further elucidated that the concentration of TNF ? in the plasma significantly increased in newly diagnosed AML patients compared to healthy individuals, aligning with the present outcome (40).
The results showed a significant decrease (P?0.05) in RBC count, percentage of Hb and HCT and Platelets in newly diagnosed (without treatment) leukemia patients compared with the treated and healthy control groups. The data showed a significant increase in the WBC count of the new diagnosis (without treatment) and treated leukemia groups compared to the healthy control group.
The initial diagnostic test for suspected leukemia is a complete blood count (CBC), which provides insight into the alterations in bone marrow function that occur when leukemic cells are present (41). An essential feature of AML is the elevation of white blood cell count in the bloodstream. According to the American Society of Hematology (2013), this increase is a result of abnormal activation of signaling pathways that control the growth and specialization of hematopoietic stem cells (42).
Alterations in hematological parameters result from the substitution of megakaryocytes and erythroid precursor cells in the bone marrow by leukemic cells (43). The current study observed that patients newly diagnosed with AML exhibited elevated white bloodcell levels cell counts t, decreased Hb levels, and reduced platelet counts t compared to the a healthy control group. The reduction in hemoglobin and platelet levels in the bloodstream of acute myeloid leukemia patients prior to chemotherapy primarily occurs because cancer cells replace normal bone marrow cells, depleting the nutrients necessary for platelet and hemoglobin production (44). Similar patterns of changes in hematological parameters were observed in a e study conducted by (45,46). Additionally, (43,47,48) also demonstrated similar patterns of changes in hematological parameters. Platelet s and hemoglobi levels. Furthermore, e cancer cells may generate substances that impede the synthesis of platelets and hemoglobin (44).
Based on the statistical analysis of the studied samples summarized in table 1, a significant decrease (P?0.05) in the gene expression of MDR1 was observed in leukemia patients without treatment (0.6447) compared to the results of other groups, leukemia patients (treated), and healthy control group (1.1401) (1.3585, respectively). The Y axis represents the mean folding of MDR1 gene expression, while the x-axis represents the three groups of analysis. Our findings, which are presented in tables 2 and 3, showed that there were no significant changes in the sex and family history of patients with AML and controls. The goal of chemotherapy is to achieve complete remission of AML and prevent relapse in post-remission therapy. Unfortunately, chemotherapy is ineffective in patients with poor risk for whom bone marrow transplantation is more effective. In the last few years, there have been changes in the diagnosis and treatment of AML based on molecular genetic assessment of expression for designing novel curative regimens that reverse the regulation of the drug-resistant phenotype of AML cells (49). Response to treatment is affected by many factors according to the risk categories associated with morphological features, genetic criteria, and age (50,51). Our findings are very much consistent with other previous reports (52), which found that a correlate with the concept of AML being an intrinsically resistant disease, and that such upregulation could be acquired during induction treatment. The over expression of MDR1 in patients undergoing treatment, compared to newly diagnosed patients, may not only be attributed to the specific chemotherapeutic drug response. Instead, the increased mRNA expression level is believed to be influenced by various stress response pathways that are involved in the regulation of P-gp expression (53,54).
Conclusion
The high serum levels of immunological parameters (IL 6, IL 10, and TNF ?) in AML patients are important indicators of an increase in the severity of the disease. All patients with AML had abnormal hematological parameters. Patients who received chemotherapy showed different levels of these parameters, such as RBC count, WBC count, HB, platelet count, and HCT. AML patients that received chemotherapy exhibited a decrease in MDR1 gene expression in comparison to other groups. A new diagnosis of a patient may have an impact on the patient’s levels.
Conflict of Interest
The author declared no any conflict of interesting.
Funding
None.
Ethical Consideration
This study was approved by the Department of Biology, College of Science, University of Thi-Qar (no. 225/2024).
References
1. Zou GM. Cancer stem cells in leukemia, recent advances. J Cell Physiol. 2007;213(2):440-4.
2. GBD 2015 Mortality and Causes of Death Collaborators. Global, regional, and national life expectancy, all-cause mortality, and cause-specific mortality for 249 causes of death, 1980-2015: a systematic analysis for the Global Burden of Disease Study 2015. Lancet. 2016; 388(10053):1459-1544. Erratum in: Lancet. 2017;389(10064):e1.
3. Kindt T, Goldsby R, Osborne B. Immunology. New York: W.H. Freeman and Company. 2007; p. 65-114.
4. Ding L, Ley TJ, Larson DE, Miller CA, Koboldt DC, Welch JS, et al. Clonal evolution in relapsed acute myeloid leukaemia revealed by whole-genome sequencing. Nature. 2012;481(7382):506-10.
5. Estey EH. How to manage high-risk acute myeloid leukemia. Leukemia. 2012;26(5):861-9.
6. Appelbaum FR, Gundacker H, Head DR, Slovak ML, Willman CL, Godwin JE, et al. Age and acute myeloid leukemia. Blood. 2006; 107(9):3481-5.
7. Deschler B, Lübbert M. Acute myeloid leukemia: epidemiology and etiology. Cancer. 2006;107(9):2099-107.
8. Tettamanti S, Pievani A, Biondi A, Dotti G, Serafini M. Catch me if you can: how AML and its niche escape immunotherapy. Leukemia. 2022;36(1):13-22.
9. Rashad I. Estimation of cytokine level IL-4, IL-12, IL-17 and some immune features among patients with Herpes zoster in Thi-Qar Province/Southern Iraq. University of Thi-Qar Journal of Science, 2023;10(1):87-90.
10. Panju AH, Danesh A, Minden MD, Kelvin DJ, Alibhai SM. Associations between quality of life, fatigue, and cytokine levels in patients aged 50+ with acute myeloid leukemia. Support Care Cancer. 2009;17(5):539-46.
11. Wei X, Li Y, Zhang G, Wang N, Mi M, Xin Y, et al. IL-37 Was Involved in Progress of Acute Myeloid Leukemia Through Regulating IL-6 Expression. Cancer Manag Res. 2021;13:3393-3402.
12. Shenghui Z, Yixiang H, Jianbo W, Kang Y, Laixi B, Yan Z, et al. Elevated frequencies of CD4? CD25? CD127lo regulatory T cells is associated to poor prognosis in patients with acute myeloid leukemia. Int J Cancer. 2011;129(6):1373-81.
13. Dawood S D. Assessment of IL-6 serum level in patients with acute myeloid leukemia. Iraqi J Cancer Med Genet. 2011;4:22-8.
14. Tahmasebi S, Alimohammadi M, Khorasani S, Rezaei N. Pro-tumori - genic and Anti-tumorigenic Roles of Pro-inflammatory Cytokines in Cancer. In Handbook of Cancer and Immunology. Cham: Springer Int Publishing; 2022. p. 1-25.
15. Cui X, Zhang H, Cao L, Hu X. Cytokine TNF-a promotes invasion and metastasis of gastric cancer by down-regulating Pentraxin3. J Cancer. 2020;11(7):1800-1807.
16. Wu S, Gessner R, Taube T, von Stackelberg A, Henze G, Seeger K. Expression of interleukin-10 splicing variants is a positive prognostic feature in relapsed childhood acute lymphoblastic leukemia. J Clin Oncol. 2005;23(13):3038-42.
17. Ebinger M, Uhr M. ABC Drug Transporter at the Blood- Brain Barrier: Effects on Drug Metabolism and Drug Response. Eur Arch Psychiatry Clin Neurosci. 2006;256(5):294-8.
18. Smith MT, Zhang L, McHale CM, Skibola CF, Rappaport SM. Benzene, the exposome and future investigations of leukemia etiology. Chem Biol Interact. 2011;192:155-9.
19. Leonard GD, Fojo T, Bates SE. The role of ABC transporters in clinical practice. Oncologist. 2003;8(5):411-24.
20. Cascorbi I, Gerloff T, Johne A, Meisel C, Hoffmeyer S, Schwab M, et al. Frequency of single nucleotide polymorphisms in the P-glycoprotein drug transporter MDR1 gene in white subjects. Clin Pharmacol Ther. 2001;69(3):169-74.
21. Hattori H, Suminoe A, Wada M, Koga Y, Kohno K, Okamura J, et al. Regulatory polymorphisms of multidrug resistance 1 (MDR1) gene are associated with the development of childhood acute lympho-blastic leukemia. Leuk Res. 2007;31(12):1633-40.
22. Bodor M, Kelly EJ, Ho RJ. Characterization of the human MDR1 gene. AAPS J. 2005;7(1):E1-5.
23. Hodges LM, Markova SM, Chinn LW, Gow JM, Kroetz DL, Klein TE, Altman RB. Very important pharmacogene summary: ABCB1 (MDR1, P-glycoprotein). Pharmacogenet Genomics. 2011;21(3): 152-61.
24. Marzolini C, Paus E, Buclin T, Kim RB. Polymorphisms in human MDR1 (P-glycoprotein): recent advances and clinical relevance. Clin Pharmacol Ther. 2004;75(1):13-33.
25. Kaltoum ABO, Sellama N, Hind D, Yaya K, Mouna L, Asma Q. MDR1 gene polymorphisms and acute myeloid leukemia AML susceptibility in A Moroccan adult population: A case-control study and meta-analysis. Curr Res Transl Med. 2020;68(1):29-35.
26. Talaat RM, YK El-Kelliny M, El-Akhras BA, Bakry RM, Riad KF, Guirgis AA. Association of C3435T, C1236T and C4125A Poly-morphisms of the MDR-1 Gene in Egyptian Children with Acute Lymphoblastic Leukaemia. Asian Pac J Cancer Prev. 2018;19(9): 2535-2543.
27. Rao VV, Dahlheimer JL, Bardgett ME, Snyder AZ, Finch RA, Sartorelli AC, et al. Choroid plexus epithelial expression of MDR1 P glyco-protein and multidrug resistance-associated protein contribute to the blood-cerebrospinal-fluid drug-permeability barrier. Proc Natl Acad Sci U S A. 1999;96(7):3900-5.
28. Leith CP, Kopecky KJ, Godwin J, McConnell T, Slovak ML, Chen IM, et al. Acute myeloid leukemia in the elderly: assessment of multidrug resistance (MDR1) and cytogenetics distinguishes biologic subgroups with remarkably distinct responses to standard chemo-therapy. A Southwest Oncology Group study. Blood. 1997;89(9): 3323-9.
29. Pallis M, Russell N. P-glycoprotein plays a drug-efflux-independent role in augmenting cell survival in acute myeloblastic leukemia and is associated with modulation of a sphingomyelin-ceramide apoptotic pathway. Blood. 2000;95(9):2897-904.
30. Haque A, Sait KHW, Alam Q, Alam MZ, Anfinan N, Wali AWN, et al. MDR1 Gene Polymorphisms and Its Association With Expression as a Clinical Relevance in Terms of Response to Chemotherapy and Prognosis in Ovarian Cancer. Front Genet. 2020;11:516.
31. Livak KJ, Schmittgen TD. Analysis of relative gene expression data using real-time quantitative PCR and the 2[-Delta Delta C(T)] Method. Methods. 2001;25(4):402-8.
32. Hu R, Ling X, Yang T, Zhang J, Gu X, Li F, et al. Cytokine levels in patients with non-M3 myeloid leukemia are key indicators of how well the disease responds to chemotherapy. Clin Exp Med. 2023; 23(8):4623-4632.
33. Kadhum MS, Abdullah AR, Shabeeb ZA. Estimation of the IL-6 serum level in the Iraqi newly diagnosed AML patients. Teikyo Medical Journal, 2022;45(1):1-12.
34. Al-Maliki N, Zahraa K. Effect of the Serum Level of Interleukin- 6 and Interleukin-10 on Chemotherapy in Acute Myeloid Leukemia Iraqi Patients. International Journal of Pharmaceutical and Bio-Medical Science. 2023;3(11):1-8.
35. Matthes T, Manfroi B, Zeller A, Dunand-Sauthier I, Bogen B, Huard B. Autocrine amplification of immature myeloid cells by IL-6 in multiple myelomainfiltrated bone marrow. Leukemia. 2015;29(9): 1882-1890.
36. Sato T, Terai M, Tamura Y, Alexeev V, Mastrangelo MJ, Selvan SR. Interleukin 10 in the tumor microenvironment: a target for anticancer immunotherapy. Immunol Res. 2011;51(2-3):170-82.
37. Wu C, Wang S, Wang F, Chen Q, Peng S, Zhang Y, et al. Increased frequencies of T helper type 17 cells in the peripheral blood of patients with acute myeloid leukaemia. Clin Exp Immunol. 2009; 158(2):199-204.
38. Tettamanti S, Pievani A, Biondi A, Dotti G, Serafini M. Catch me if you can: How AML and its niche escape immunotherapy. Leukemia. 2022;36(1):13- 22.
39. Tsimberidou A M, Estey E, Wen S, Pierce S, Kantarjian H, Albitar M, et al. The prognostic significance of cytokine levels in newly diagnosed acute myeloid leukemia and high risk myelodysplastic syndromes. Cancer. 2008;113(7):1605-1613.
40. Wang M, Zhang C, Tian T, Zhang T, Wang R, Han F, et al. Increased regulatory T cells in peripheral blood of acute myeloid leukemia patients rely on the tumor necrosis factor (TNF)-a–TNF receptor-2 pathway. Front Immunol. 2018;9:1274.
41. Moussavi F, Hosseini S, Saket S, Derakhshanfar H. The First CBC in Diagnosis of childhood acute lymphoblastic leukemia. International Journal of Medical Investigation. 2014;3(1):1-6.
42. Levis M. FLT3 mutations in acute myeloid leukemia: what is the best approach in 2013? Hematology 2013, the American Society of Hematology Education Program Book. 2013;2013(1):220-6.
43. Naeem R, Naeem S, Sharif A, Rafique H, Naveed A. Acute Myeloid Leukemia: Demographic Features And Frequency Of Various Subtypes In Adult Age GROUP. The Professional Medical Journal. 2017;24(09):1302-5.
44. Masetti R, Vendemini F, Zama D, Biagi C, Pession A, Locatelli F. Acute myeloid leukemia in infants: biology and treatment. Frontiers in pediatrics. 2015;3:37.
45. Al-Dulaimi SM, Al-alwani HR, Matti BF. Study of the hematological parameter changes of Iraqi Acute Myeloid Leukemia patients before and after Chemotherapy Journal of Population Therapeutics & Clinical Pharmacology. 2023;30(12):210-217.
46. Sultan S, Zaheer HA, Irfan SM, Ashar S. Demographic and clinical characteristics of adult acute Myeloid Leukemia-tertiary care
experience. Asian Pacific Journal of Cancer Prevention. 2016;17(1): 357- 60
47. Chang F, Shamsi TS, Waryah A. Clinical and hematological profile of acute myeloid leukemia (AML) patients of Sindh. Journal of Hematology & Thromboembolic Diseases. 2016;4(2):1-5.
48. Preethi C. Clinico-hematological study of acute myeloid leukemias. Journal of Clinical and Diagnostic Research: JCDR. 2014;8(4):FC14.
49. Cianfriglia M. The biology of MDR1-P-glycoprotein (MDR1- Pgp)in designing functional antibody drug conjugates (ADCs): the experience ofgemtuzumab ozogamicin. Ann. Ist. Super. Sanità. 2013; 49(2):150-68.
50. Ismail MA, Hosny SM. Prognostic significance of progenitor cell markers in Acute Myeloid Leukemia. Life Science Jornal. 2011;8(4): 680-686.
51. Yanada M, Naoe T. Acute myeloid leukemia in older adults. Int J Hematol. 2012;96:186-193.
52. Jwad HAM. Assessment of Exon 2 and 3 Mutations in NPM1 Gene and Studying the Gene Expression of MDR1Gene in some Acute Myeloid Leukemia Patients in Iraq, College of Science – Dept. of Biotechnology Al-Nahrain University. THESIS. 2017.
53. Kantharidis P, El-Osta S, Silva M, Lee G, Hu XF, Zalcberg J. Regulation of MDR1 gene expression: emerging concepts. Drug Resist Updat. 2000;3(2):99-108.
54. Stordal B, Hamon M, McEneaney V, Roche S, Gillet JP, O'Leary JJ, Gottesman M, Clynes M. Resistance to paclitaxel in a cisplatin-resistant ovarian cancer cell line is mediated by P-glycoprotein. PLoS One. 2012;7(7):e40717.
Full Text Sources:
Abstract:
Views: 1044

For Authors
Journal Subscriptions

Dec 2025
Supplements
Instructions for authors
Online submission
Contact
e-ISSN: 2601 - 1700 (online)
ISSN-L: 2559 - 723X
Journal Abbreviation: Surg. Gastroenterol. Oncol.
Surgery, Gastroenterology and Oncology (SGO) is indexed in:
- SCOPUS
- EBSCO
- DOI/Crossref
- Google Scholar
- SCImago
- Harvard Library
- Open Academic Journals Index (OAJI)
Surgery, Gastroenterology and Oncology (SGO) is an open-access, peer-reviewed online journal published by Celsius Publishing House. The journal allows readers to read, download, copy, distribute, print, search, or link to the full text of its articles.
Time to first editorial decision: 25 days
Rejection rate: 61%
CiteScore: 0.2

Meetings and Courses in 2025
Meetings and Courses in 2024
Meetings and Courses in 2023
Meetings and Courses in 2022
Meetings and Courses in 2021
Meetings and Courses in 2020
Meetings and Courses in 2019
Verona expert meeting 2019

Surgery, Gastroenterology and Oncology applies the Creative Commons Attribution Non Commercial (CC BY-NC 4.0) license, which permits readers to copy and redistribute the material in any medium or format, remix, adapt, build upon the published works non-commercially, and license the derivative works on different terms, provided the original material is properly cited and the use is non-commercial. Please see: https://creativecommons.org/licenses/by-nc/4.0/
Publisher’s Note:
The opinions, statements, and data contained in article are solely those of the authors and not of Surgery, Gastroenterology and Oncology journal or the editors. Publisher and the editors disclaim responsibility for any damage resulting from any ideas, instructions, methods, or products referred to in the content.